Bigger Bookbag for Anya — Interior

After cutting and laminating the fabric for the interior of Anya’s bookbag, I finally sewed it today. We still need to order the zipper online — we went to the craft store last week (and got caught in a snowstorm heading home!), but Anya’s zipper selection was only stocked in 9″. I’ll order the 22″ version online, and then we’ll have all of the bits and pieces to complete the bag.

Did you know … Excel can use maps to visualize data?

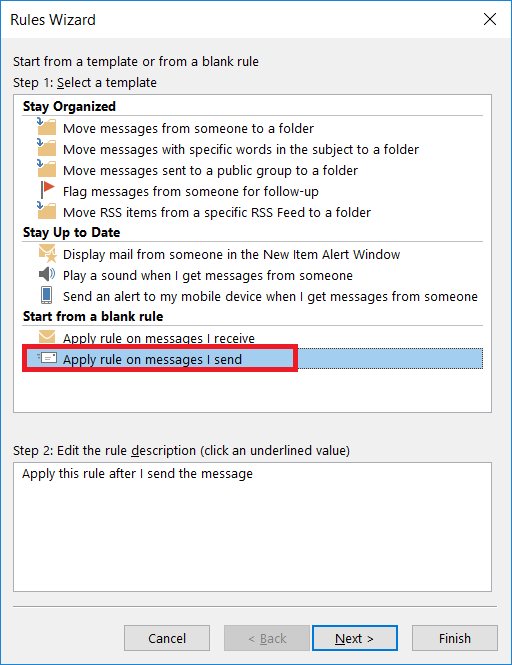
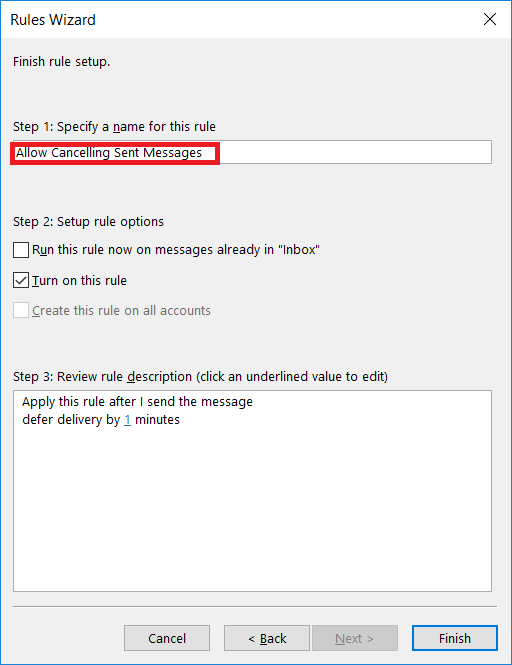
I remember visiting my uncle at a NASA design lab sometime in the mid-80’s – it was a huge cavernous room that he explained used to house the computer. A computer his graphing calculator could draw circles around. It was a powerful visual reminder how quickly computing technology advances – components are smaller, more powerful, and simpler to use.

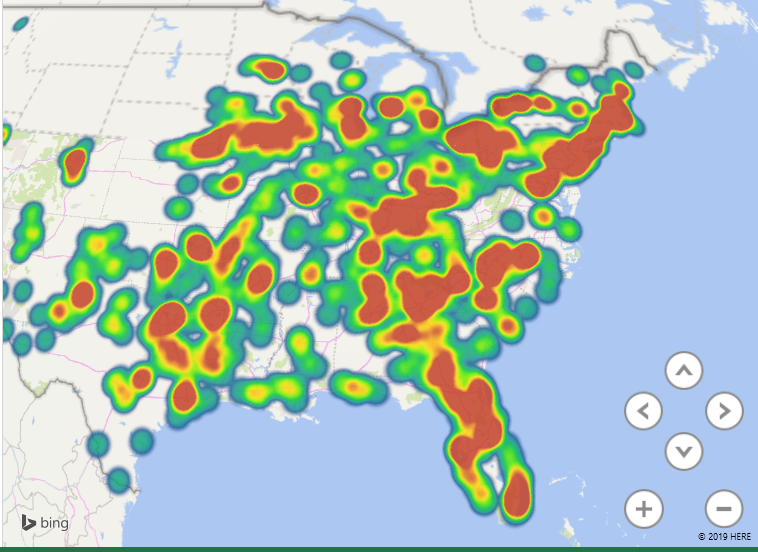
More than two decades ago, I wrote a visualization application that presented a graphical representation of the geographic distribution of records. Which is a long way of saying it showed where something happened to a lot of people. The application was part of a cooperative effort between the FBI and local law enforcement – a data mining project meant to identify serial offenders across jurisdictional boundaries I wanted to be able to visualize where different types of crime were occurring and identify anomalies, so I built a program to do so. It took months to develop and took hours to crunch values and draw a map. The first time I used Excel to visualize frequency distribution on a map, I thought of that NASA computer room. What used to take a high-end Unix server with a RISC processor and tonnes (for the time) of memory – not to mention an entire summer of code development – is clickity-click and done on my little laptop. And the results are nicer:

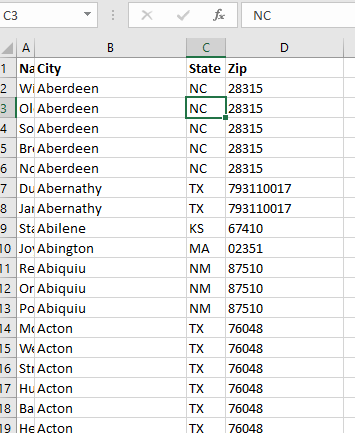
How do you create this type of visualization? First you need data with something that is mappable – the example here is going to show the office locations listed in PeopleSoft. Click within the data set.

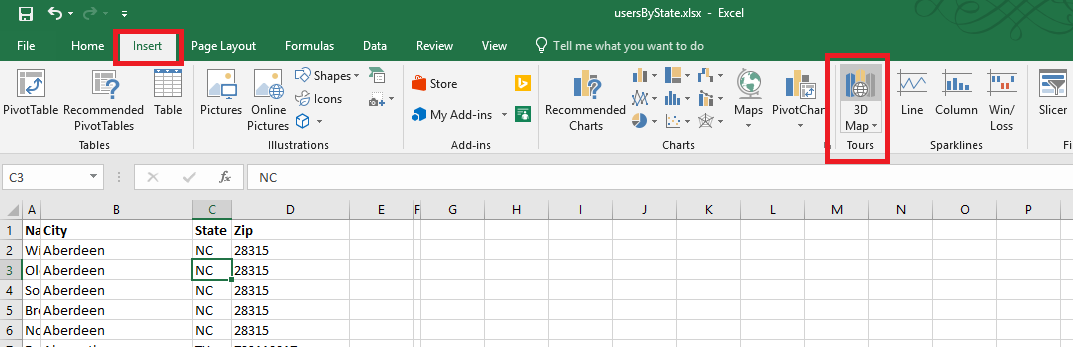
On the ribbon bar, select “Insert” then select “3D Map” in the “Tours” section.

If you have not used it before, you will be asked to enable data analysis service.

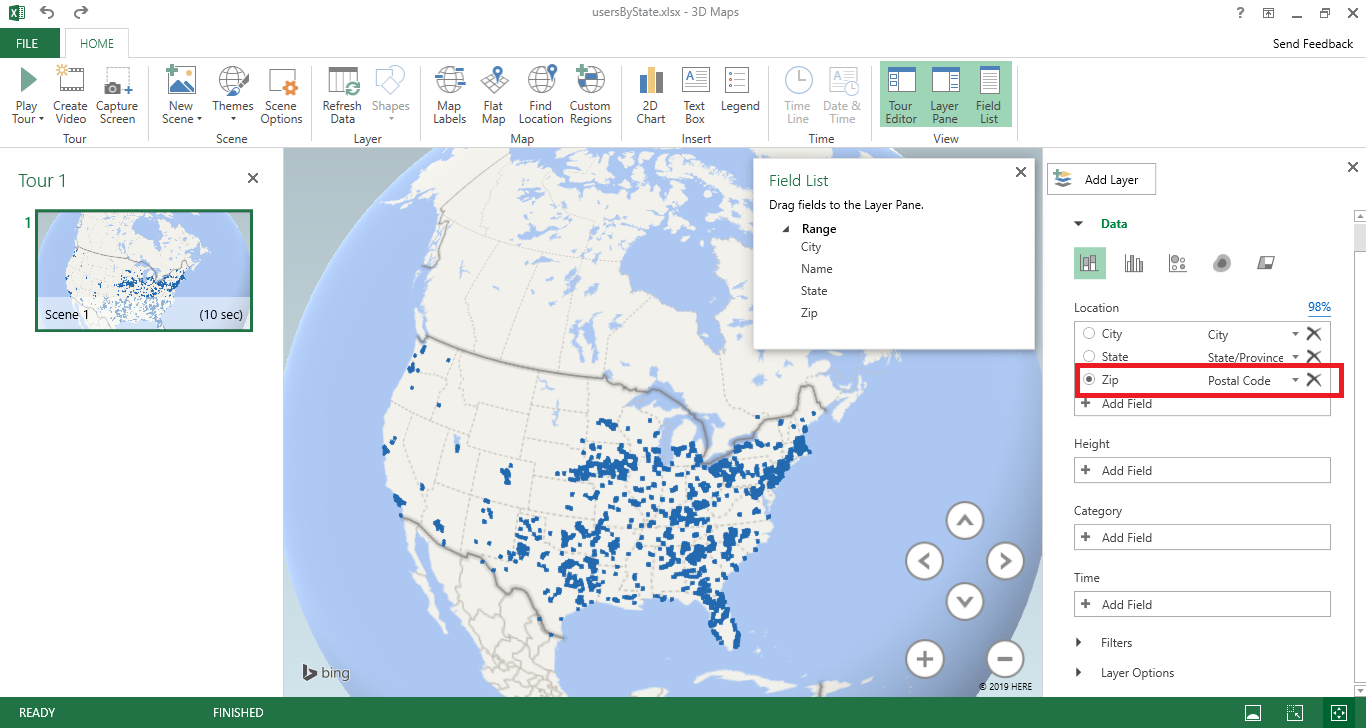
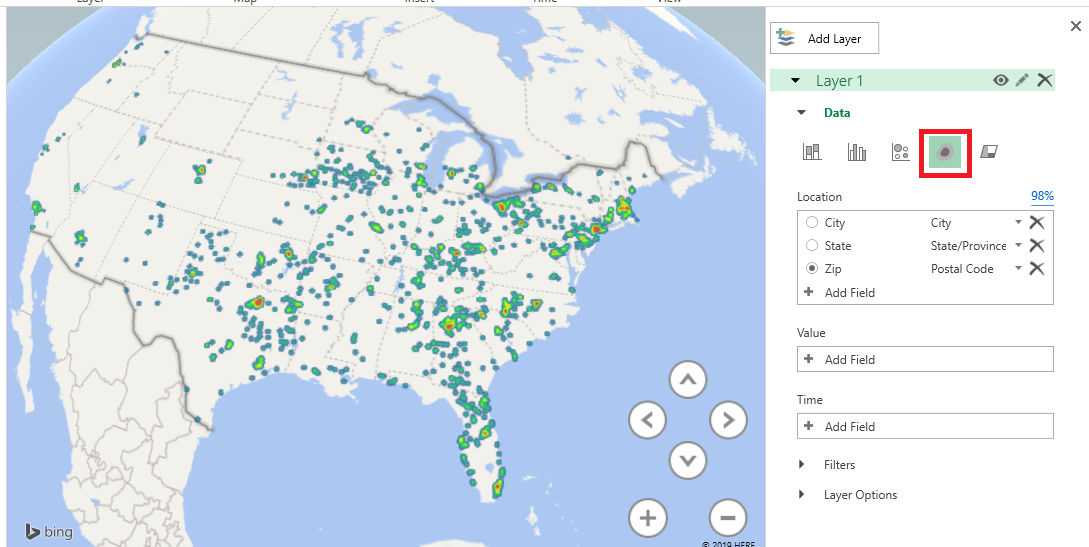
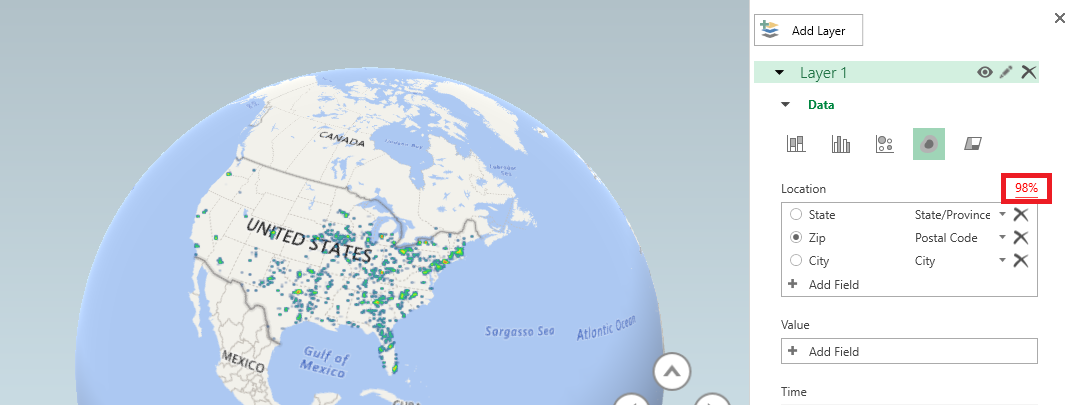
A new window will be displayed – select the column you want to map. Here, I am using zip codes, which is mapped to the “Postal Code” field in my spreadsheet. If your fields do not map automatically, you will need to click the drop-down next to a location data type and select the appropriate column.

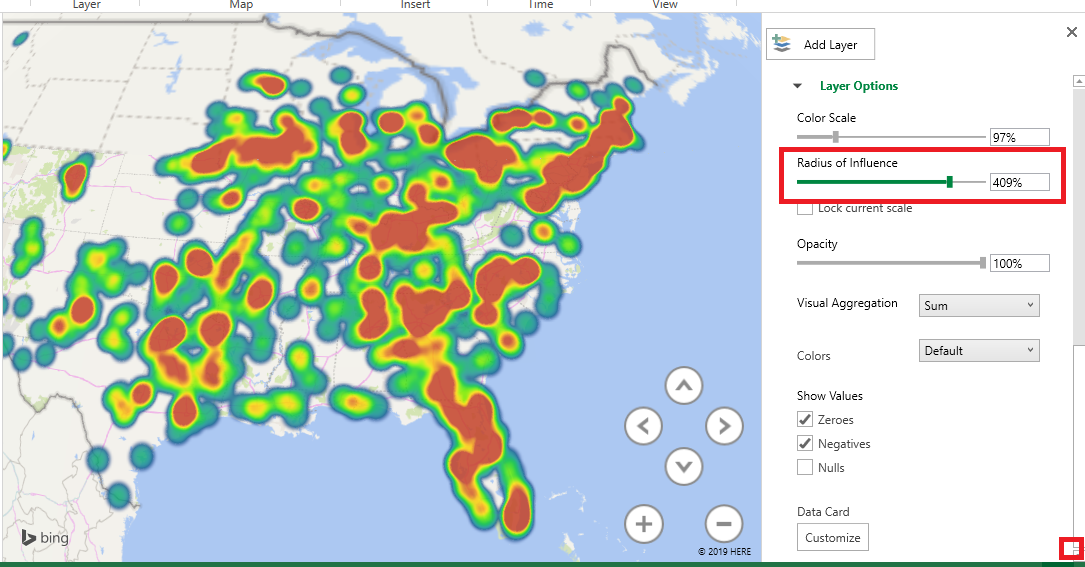
There are different types of visualization – here, I have switched to a “heat map” where the color of the blob represents how many records fall into this zip code. It is a quick way of identifying clusters – hot spots.

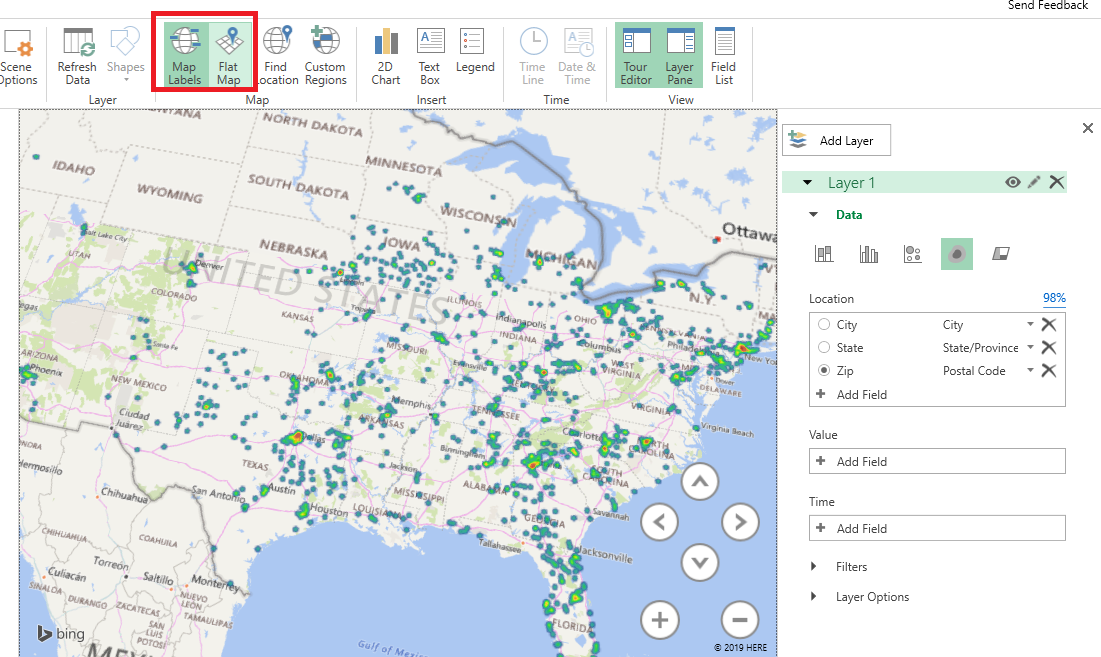
You can control the look of the map as well – here, I have switched to a flat map and added location labels.

If you would like to include a copy of your map in another program – say, this Word document – select “Capture Screen” from the ribbon bar. You can also create a video to show an animated view of your map (zooming in on specific locations, rotating the globe to see people over in Mongolia)

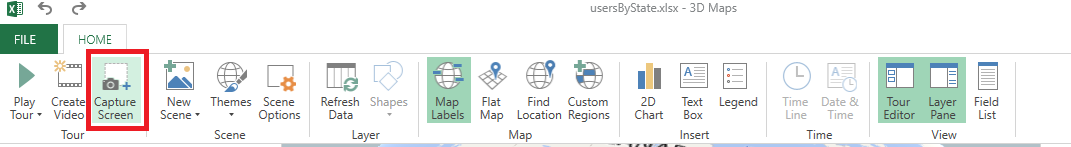
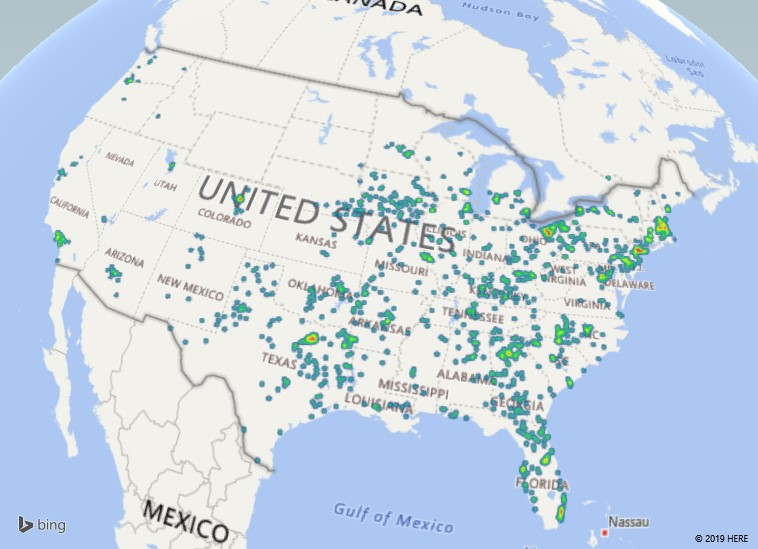
After you’ve clicked “Screen Capture”, just paste and an image of your map will be inserted into your file – see!

Going A Little Farther:

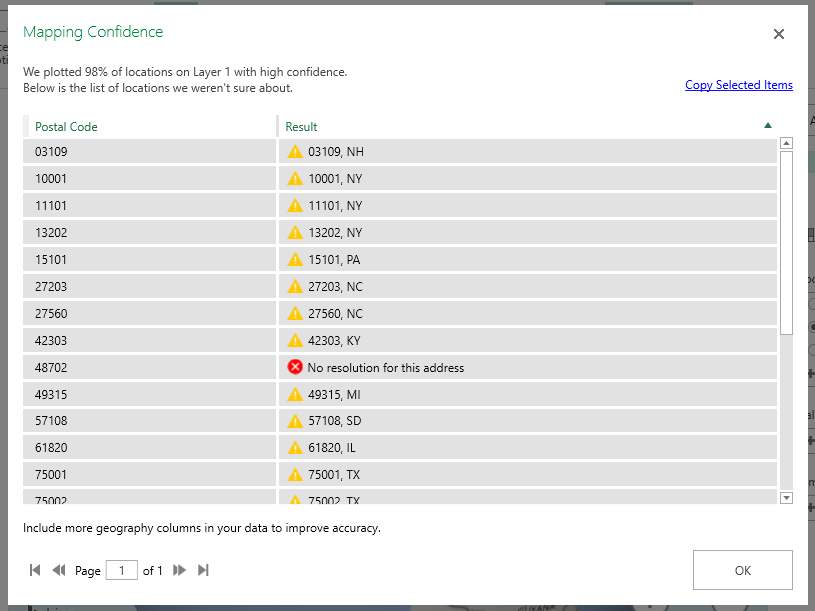
Data isn’t perfect, and even when the data looks good it may not map properly. My sister used to live on a street in New Jersey that does not exist on a map. The post office affirmed it was the correct address, but UPS and FedEx claimed it didn’t exist. It was funny to me, but I wasn’t the one trekking two kids down to the neighbor on the main road who nicely accepted packages for her. She moved before they ever got the address situation sorted, but I’ve got first-hand experience with addresses that don’t map in some systems but are perfectly fine in others. Why do I mention this? The map visualization provides a “Mapping confidence” statistic – it is the percentage that appears above the box where you select the location data to be mapped. 98% is pretty good – there are a handful of records that don’t appear on the map … but the data I am presenting is a decent representation of our employee office locations. A low percentage would indicate that your map does not accurately convey your data.

What if my map confidence level is low? Click on the map confidence value to see what didn’t map. There are some marked with a result that is questionable – spot-checking them, 03109 is Manchester NH and 10001 is New York, NY. The one with no resolution, according to the US Postal Service lookup isn’t a valid postal code. If your data is wrong, fix it 😊 In cases where the data is right but the application isn’t confident about the location, you can add additional data to make the address more specific (here, I might increase the confidence by having the zip+4, or including the street address in my data set).

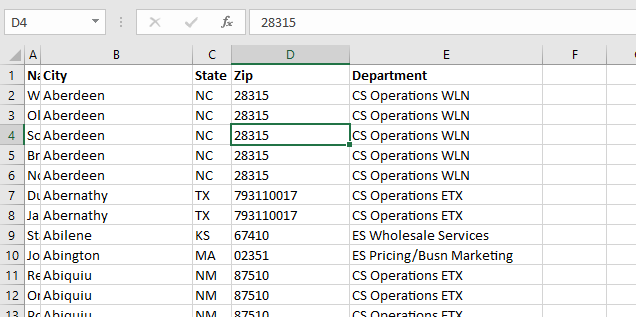
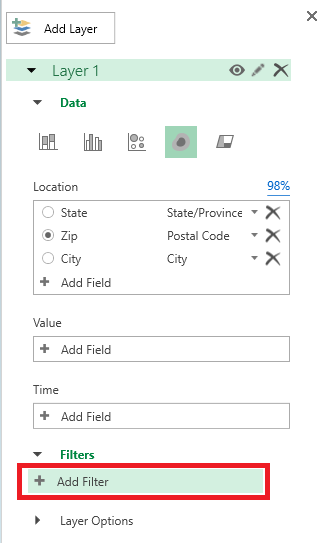
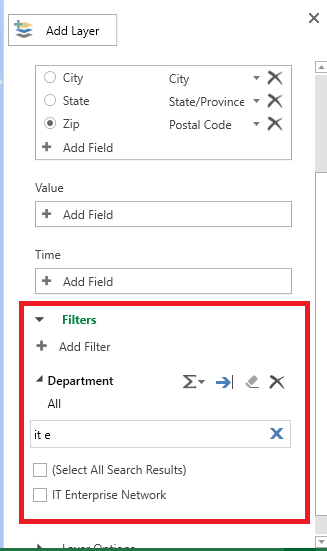
You can filter data in your map – first we’ll need some field on which to filter. Here, I’ve added the employee’s department to my data set.

On the right-hand pane, expand “Filters”. Click “Add filter”.

Select the column on which to filter data. A unique list of values will be presented – you can scroll through it or start typing the value to search. Once you find what you want to display, click the check-box before the value.

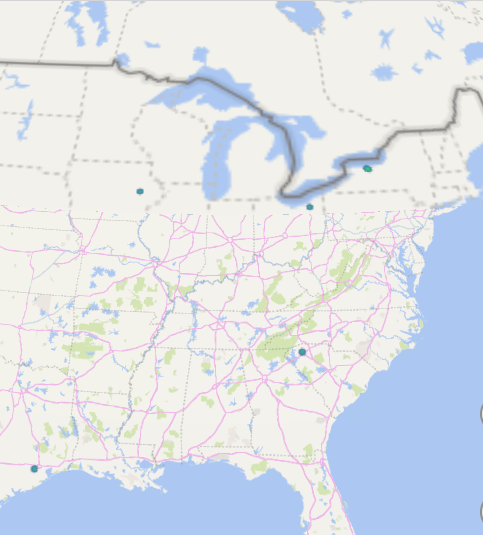
Now we are visualizing where people in my department work.

If your data is hard to see – records are distributed out fairly evenly across the map – you can increase the area of influence to make smaller clusters easier to identify. Scroll to the bottom of the right-hand pane and drag the “Radius of influence” slider to the right. If you have very clustered data, you can drag the slider to the left to turn a large red blob into a more nuanced visualization.

When you have finished visualizing your data, click “File” on the ribbon bar and select “Close”.


Moving A Microsoft Form Can Change The Form ID

Create a personal form at https://forms.office.com

Look at the form ID – it’s in the form URL

Now I’ve tested it & I’m ready to use it. I need to grant the rest of my team rights to modify the form. Click the fallen-over hamburger menu on the form

Select “Move”

Pick Teams space and click “Move”

Return to your Form – in the URL, look at the Form ID again. Compare it to the original … they don’t match!

Why do I mention this? Well, if you use a form in Flow … it is referenced by the form ID. Creating a personal form, building a workflow in flow, then moving the form to your Teams space to allow others to edit it breaks the workflow. When you go into the Flow to add additional owners, you’ll need to update the Form ID as well. If you don’t update your Flow, it will start failing. Oddly not at the initial “when a new response is submitted” step where I would expect it to fail if the Form ID was not valid but at the “get response details” step.

Looking at the error detail on “get response details”, the status code is 404 (HTTP error for ‘not found’, so I assumed it was used in the same context). The result body has an error code 639 which I couldn’t find anyone talking about online.

Did you know … you can cancel sending an e-mail in Outlook?

Anyone who has mis-addressed a message or hit ctrl-enter and prematurely sent, well, some of a message has probably found the message “recall” option. Unfortunately, “recall” depends on the recipient having “Automatically process requests and responses to meeting requests and polls” enabled, cannot recall the message if the recipient has a rule that moves the message out of their inbox, and doesn’t work if the recipient isn’t using Exchange. Many times, your attempt to recall a message yields another message like this:

Which is better than someone thinking I meant to send them half of a thought that stopped mid-sentence. But it’s not what I expected. You can, however, configure Outlook to delay sending messages … allowing you a little time to cancel the message.

Outlook Client:

On the ribbon bar, click “File”. On the ‘Account Information’ screen, click “Manage Rules & Alerts”

Click “New Rule…”

In the new rule wizard, select “Apply rule on messages I send”

Do not select any conditions – just click “Next”.

You will see a warning that the rule will be applied to all messages you send – click “Yes”.

Click the check-box before “defer delivery by a number of minutes”, then in the text below click the hyperlinked ‘a number of minutes’ and enter the number of minutes you want to delay sending messages. Use a small number – if you close Outlook before the message is sent, it will not be sent until you re-open Outlook! (Plus it’s confusing if you’re on a call with someone, tell them you are sending them something, and it doesn’t actually send for fifteen minutes). Click ‘Next’ to continue.

Give your rule a descriptive name, then click “Finish”.

You will be warned that the rule will only run if Outlook is running – click OK. If you routinely use Outlook on two different computers, you’ll need to create this rule on both computers.

Now when you send a message, you will see a counter next to “Outbox”. The message will sit there for the time you specified, then it will be sent. Once the message is sent, the counter will disappear.

If you want to stop the message from being sent, click on “Outbox”.

Right-click on the message – you can select “Move” and move the message back to your “Drafts” folder or you can delete it.

Outlook Web:

Click the “Settings” gear in the upper right-hand corner of your screen.

Click on “Mail” to display the mail-related settings.

Expand “Automatic processing” and click on “Undo send”

Click the radio button to select “Let me cancel messages I’ve sent for:” then click the drop-down to select how long sending will be delayed. Pending messages won’t be sent if you close your browser or put your computer to sleep – they’ll still be there when you open Outlook again. Click save.

Now when you send a message, it will be deferred in your “Drafts” folder for the selected time period. While the message is deferred, you will see a “Cancel send” option in the upper right-hand corner of your Outlook Web screen. If you don’t want to send the message, just click “Cancel send”.

The message will be opened to allow you to continue editing it. You can save it as a draft or discard it as well.

I’ve seen the future …

This will go totally meta — he’s going to deny having denied that he denied denying collusion. At some point, dude is going to deny having been Trump’s attorney / spokesperson / lacky. Then we’ll meander our way into a whole “je pense, donc je suis” discussion because maybe we don’t even exist at all. Bad debate tactic, but I’m coming to see Trump’s approach to public discourse like the guerilla warfare American Revolution approach to European combat tactics. Considered terrible form at the time, but effective as anything. Which, sadly, dictates that we’ll *all* be debating substantive topics by throwing baseless attacks, making shit up, and derailing the conversation with a heap of crazy.

WordPress 5 AutoSave Issue

I upgraded to WordPress 5 back when it was still in preview, and wasn’t shocked to find some issues. When I would create a post, WordPress would go into an auto-saving loop. Now I like the idea of background saves to prevent data loss if by browser falls over … but the instant the auto-save would complete, another would kick off and the editor was basically unusable (copy content / refresh page / paste content / cross fingers that the auto-save loop didn’t happen that time). I tried setting the auto-refresh interval in the config file, but that had no impact.

With the 5.0.0 release, I was dismayed to find the problem lingering but 0.0 releases usually have some quirks too. But two dot-dot releases later, and a lot of frustration that auto-save has caused waaaay more data loss in six months than years worth of browser glitches ever managed, I started researching the problem to find a solution other than “wait for the next release to fix it”.

I came across an issue on GitHub which not only reports the same issue, but included a bit of code to add to the theme functions.php file:

add_filter( 'block_editor_settings', 'jp_block_editor_settings', 10, 2 );

function jp_block_editor_settings( $editor_settings, $post ) {
	$editor_settings['autosaveInterval'] = 2000; //number of second [default value is 10]

	return $editor_settings;
}

And my WordPress is usable again!

Did you know … you can reply to an e-mail message with a meeting request?

Sometimes it is easier to take a few minutes, get everyone together, and talk about something. Switching from an e-mail thread to a meeting invitation, though, means you’ve got to copy/paste all of the recipients and provide a message summary so attendees have a clue about what you want to meet. Did you know that you can reply to a message with a meeting request? All message recipients are included in the invitation, and the message content is copied into the meeting request.

Web Mail:

Click the drop-down next to reply and select “Reply all by meeting”

A new meeting request will be constructed – complete with attendees (addresses in he ‘to’ line become required attendees, cc’s become optional attendees), a meeting subject, and the entire e-mail thread in the meeting body.

Outlook:

In Outlook, click on the “Meeting” button in the ‘Home” ribbon bar.

Again, a meeting request is created with attendees, subject, and message content.

Anything you can do in a manually created meeting request can be done here – if you want to add a Teams meeting space or set up recurrence … this is a normal meeting request, it’s just got a lot of information pre-populated.

Continuous Bias Tape

For Anya’s new book bag, I need piping — which is basically paracord wrapped in bias tape. My last few projects, making the bias tape has been an all day endeavor. ALL.DAY.LONG. Lining up, sewing, pressing, lining up, making sure I have the seams facing the right way, sewing, pressing …

I had seen people talk about one-cut methods for making loads of bias tape, so I decided to research alternate techniques. This is SO easy, I feel a little silly about the amount of time I put into quilt bindings and piping.

You start with a square of fabric — how much fabric? That depends! How much bias tape do you want? The number of square inches of bias tape is almost the number of square inches of the square with which you start — you’ve got to subtract out the square inches lost to the seam allowance. The seam is sewn along the sides of the square, and there is 2x the seam allowance per seam. Which means we’re subtracting 4x (two seams!) the length of the square’s side times the width of the seam allowance. Subtract that from the square inches of the original square and you’ve got the remaining square inches. To find the length of the tape, divide by the width of the tape. You could reverse the equation so an input desired length of tape produces a measurement for your square. Or make a quick spreadsheet and try different square sizes until you get close. Now the fabric will stretch, and your measurements won’t be perfect … but you should be close to the calculated length.

Now how do you make it? Start with a square, bisect it so you have two right triangles. Place the triangles so the right angles are on opposite sides — the 45 degree angle on one should be nested in the 90 degree angle of the other. Sew along the bottom edge — where the pins are below. Now you’ve got a parallelogram.

Draw lines the width you want your bias tape to be. I drew on both the front and back of the fabric so i was easy to line up. Pull the long corners of the parallelogram past the center — they’ll overlap a bit. You want each set of lines on one side to match up to the next line on the other side. But not meet up at the edge — you want them to meet up at your seam allowance. This is a little tricky, and it took me a time or two pinning and checking before the met at the right spot. Make sure both of your seams are on the same side of the tube. Stitch the two sides together. Cut along the line.

And you’ve got a long strip of bias tape. Fold it! To make piping, I folded it in half around paracord (yes, I’m sure cotton piping is cheaper, but I’ve got lots of paracord already, and it works).

Did you know … you can change Word’s built-in Styles?

Using Styles in Word has some advantages – one-click to apply a variety of format options, the “Navigation” tool provides quick access to “heading” items, the automatic table of contents uses “heading” items too (and you can instantly update automatic table of contents data as new content is added and page numbers change) – but what can you do if the predefined text format doesn’t fit your document?

Themes

Under the “Design” ribbon bar, you will find an array of themes.

Selecting a different one changes the colors, font faces, font weight, and font sizes used throughout the document. You can change your document to look like this

Or this

Customize Styles

What if the styles still don’t fit your document? I, as an example, prefer my headings bolded and sub-headings both bolded and italicized. You can customize a theme to match your specific preferences.

On the ribbon bar, select “Home”. In the “Styles” section, right-click on the style component you want to change and select “Modify”.

Modify the style component as desired – change the font face, make it bolder, change the size, change the color, add a little more space between lines, whatever you want. Click the box to ‘Update Automatically’ and, if you want to use this customization in other documents, select the radio button that says ‘new documents based on this template’. Click “OK”.

Sections of your document using that style component will be updated. I have customized all of the style components – normal, headings, title and subtitles, quotes, etc.

On the ribbon bar, select “Design”. Click the “Themes” drop-down and select “save current theme”.

If you want to use your theme on every document you create, click “Set as Default”.

Click ‘Yes’ to confirm the change.