Month: January 2019

Did you know … you can remove duplicates in Excel?

I use Excel’s COUNTIF function a LOT for reporting. When I want to count the number of transactions that occurred per day (or during a date range), it’s easy enough to get the list of IF’s to count. But when I need to find the occurrence of different text strings, I need a unique list of the strings first. “Remove duplicates” quickly exactly what I need.

In this example, I have a list of all employees and contractor’s departments and titles – I want to know how many people are in each department and how many people have each title. Removing duplicates modifies the data, so the first step is to make a copy of the spreadsheet. Highlight the data. Select “Data” on the ribbon bar, then select “Remove Duplicates”

Select the column(s) where you want to remove duplicate data. This could be exact duplicates across multiple columns (e.g. the unique “City, State” combinations), or (in this case) I just want a unique list of departments. Click OK.

A summary will be displayed showing you how many records were removed and how many unique values remain.

Now that I have a complete listing of departments, I can use my COUNTIF function to show how many employees and contractors are in each department.

Remove duplicates only deletes records within the highlighted data. Here, I have a list of all employee titles next to the department and count info we just created. If I highlight just the ‘Title’ data and click “Remove Duplicates”, the department and count information is left unchanged.

Now I have a unique list of titles as well.


Did you know … you can be notified when changed are made to a SharePoint Online Wiki?

My group has started using a SharePoint Online Wiki – it’s a quick way to have an aesthetically pleasing knowledge base, but I’d rather not have to check “Updated Pages” periodically to see if there’s new content. Configuring SharePoint to notify me when new pages are added (or existing pages updated) avoids needing to check for new content.

From the Wiki, click “Page”

On the “Page” ribbon bar, select “View All Pages”

Click “Library” in the ribbon bar, then click the “Alert Me” drop-down.

Select “Set an alert on this library”

Configure your alert – you can receive notifications when new pages changed or added or only when new pages are added.

You can filter out changes you make by selecting “Someone else changes a wiki page”, and you can receive digest updates instead of getting a notification for each individual change. Click “OK” to save the notification, and you’ll start getting e-mails when the Wiki is updated.

If you want to adjust or cease receiving the alerts, select “Manage My Alerts” instead of ‘Set alert on this library’

Click on the alert name to edit the alert (or check the box in front of the alert name and select “Delete Selected Alerts” to remove it).


Creating An Azure Bot – Internally Hosted

While hosting a bot on the Azure network allows you to use pre-built solutions or develop a bot without purchasing dedicated hardware, the bots we’ve deployed thus far do not have access to internally-housed data. And program execution can be slow (expensive, or a combination of the two) depending on the chosen pricing plan. But you can build an Azure bot that is essentially a proxy to a self-hosted bot.

This means you can host the bot on your private network (it needs to be accessible from the Azure subnets) and access internal resources from your bot code. Obviously, there are security implications to making private data available via an Azure bot – you might want to implement user authentication to verify the bot user’s identity, and I wouldn’t send someone their current credit card information over a bot even with authentication.

How to Communicate with a Self-hosted Bot from Azure:

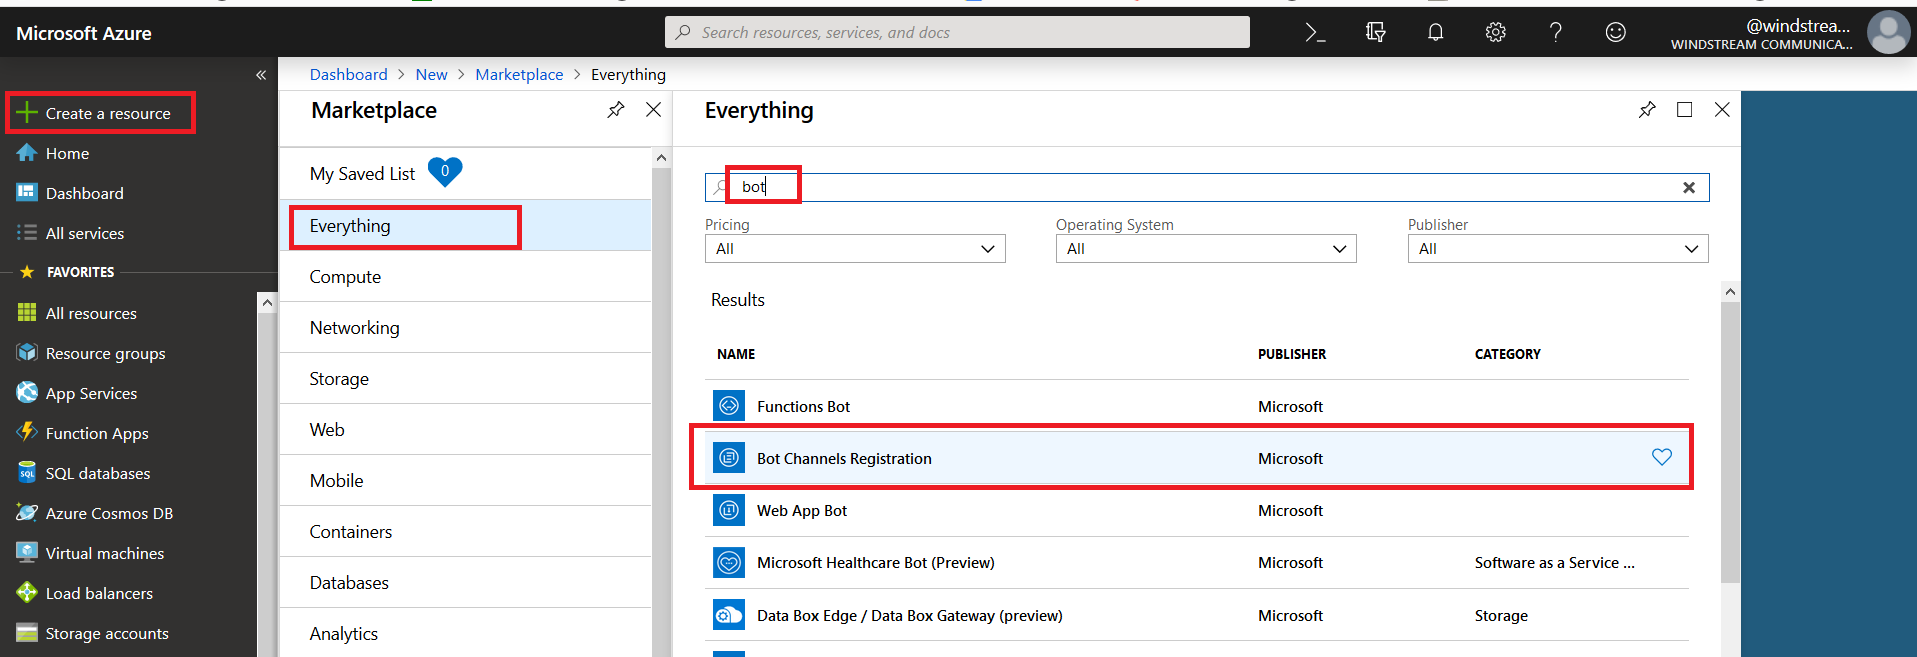
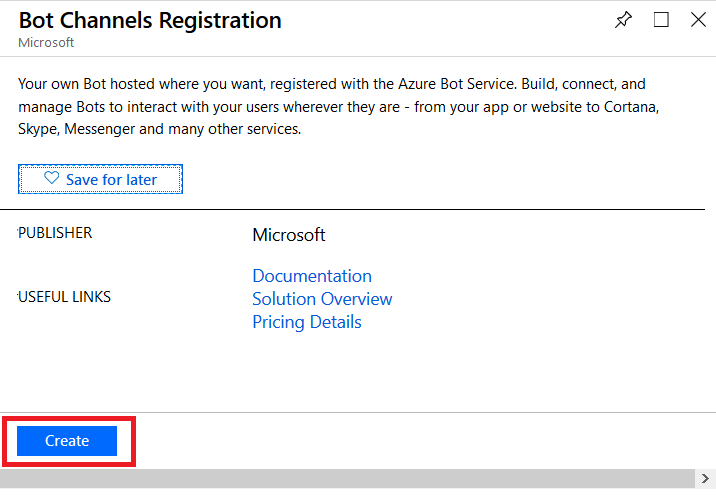
Register an Azure bot. From https://portal.azure.com, select “Create a resource”. Search for “bot” and select “Bot Channels Registration”.

On the pane which flies out to the right, click “Create” (if you will be deploying multiple self-hosted bots to Azure, click the little heart so you can find this item on “My Saved List” when creating a new resource).

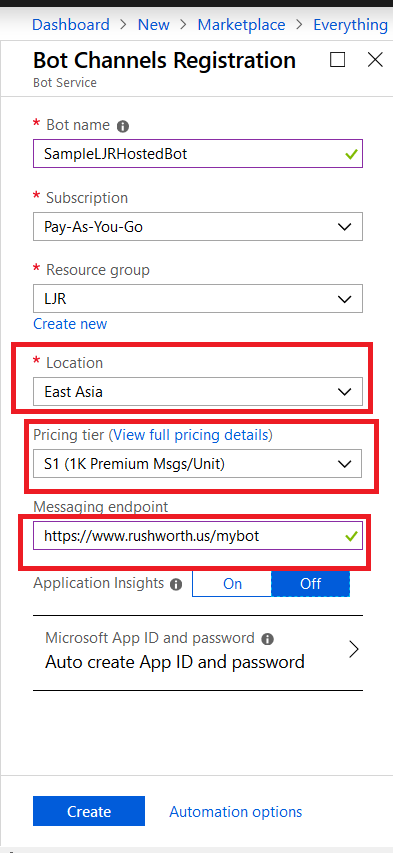
Provide a unique name for your Azure bot. If you have not yet created a resource group, you will need to create one. Make sure the hosting location is reasonable for your user base – East Asia doesn’t make sense for something used on the East coast of the US!

Select the pricing tier you want – I use F0 (free) which allows unlimited messages in standard channels (Teams, Skype, Cortana) and 10,000 messages sent/received in premium channels (direct user interaction … which I specifically don’t want in this case). Then provide the endpoint URL to interact with your locally hosted bot.

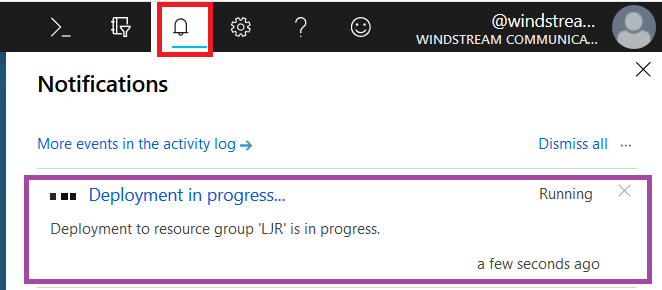
Click “Create” and Azure will begin deploying your new resource. You can click the “Notifications” bell icon in the upper right-hand portion of the page to view deployment progress.

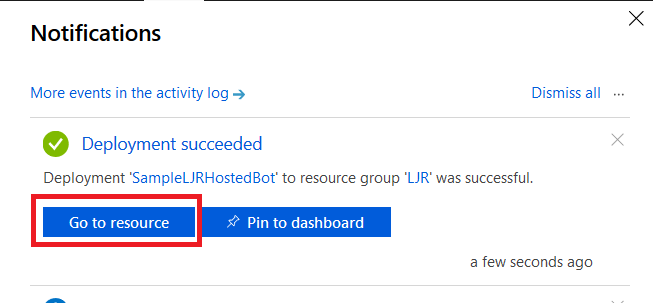
When deployment completes, click “Go to resource” to finish configuring your Azure bot.

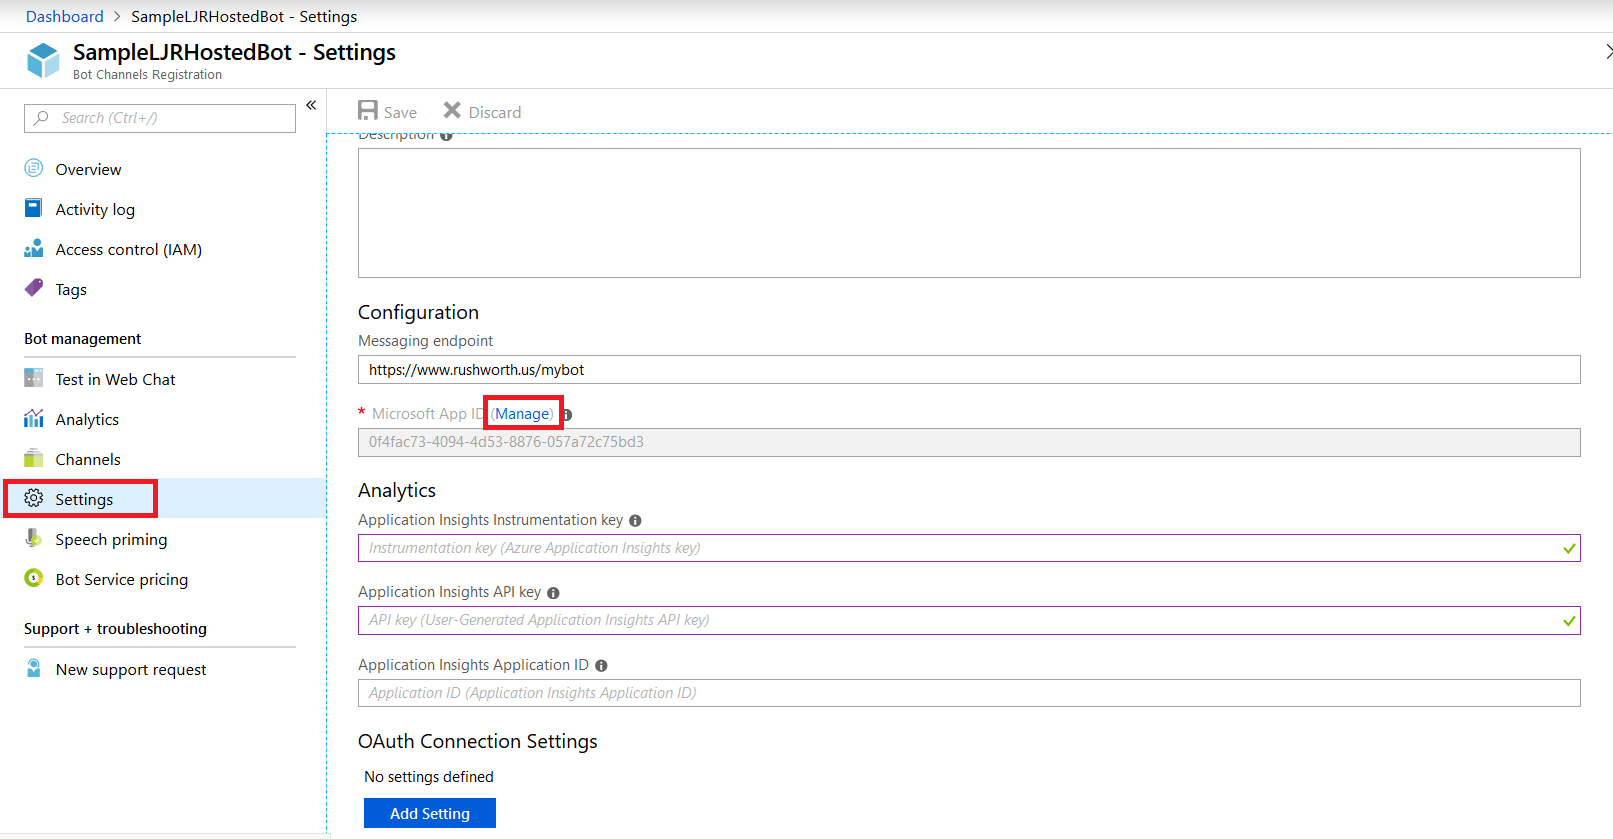
Select “Settings” from the left-hand navigation menu, then find the application ID. Click “Manage”.

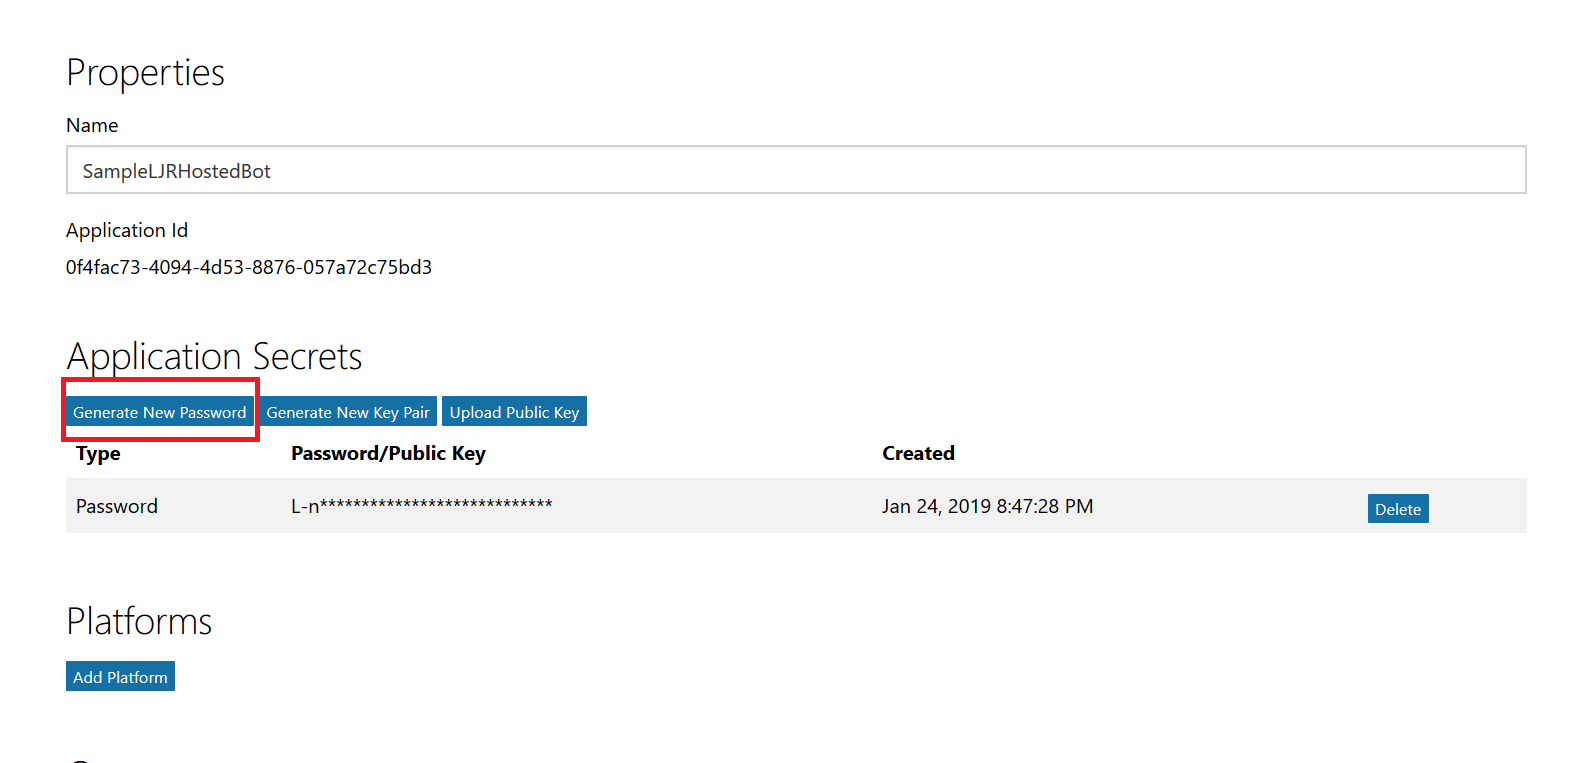
This will open a new portal – you may be asked to sign in again. You are now looking at the application registration in Microsoft’s developer application registration portal. There’s already an application secret created but beyond the first few letters … what is it? No idea! I’m a cautious person, and I don’t know if MS has embedded this secret somewhere within the bot resource. Since an application can have two secrets simultaneously, I do not delete the automatically-created secret and click “Generate New Password”.

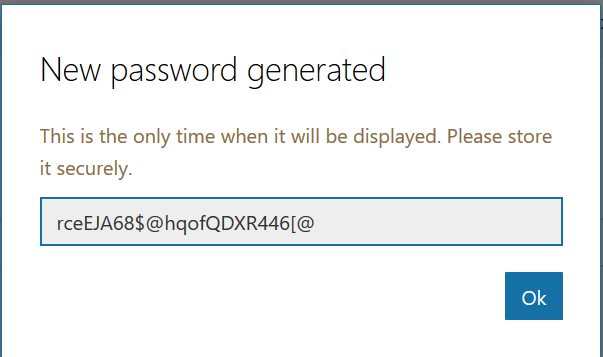
A new pane will appear with your new secret – no, the one in the picture isn’t real. Copy that and store it somewhere – you’ll need to add it to your bot code later.

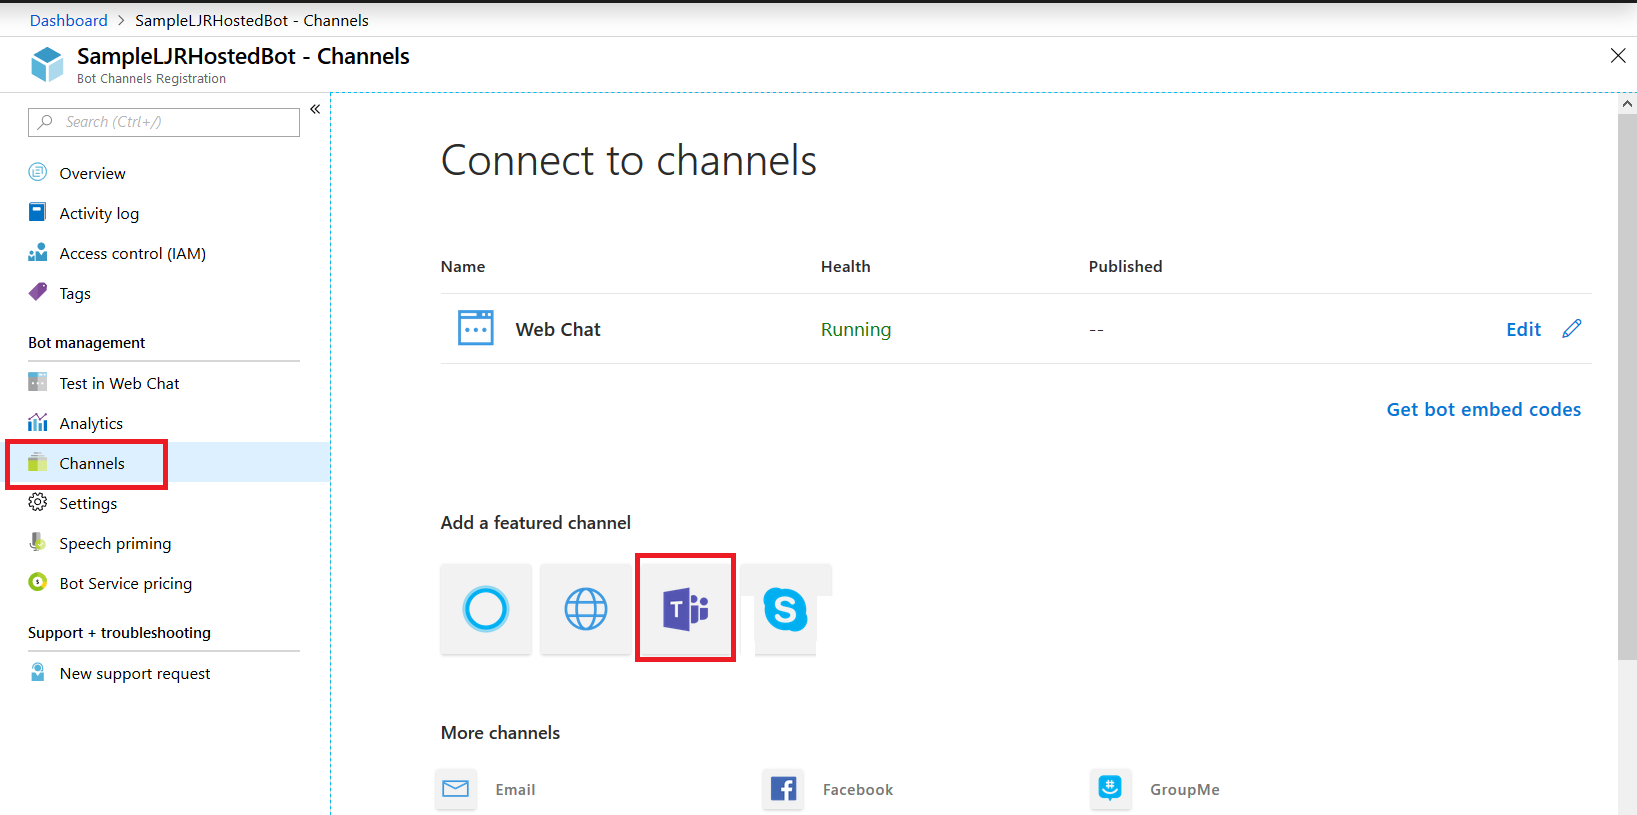
Close the application registration tab and return to the Azure portal tab. Click on “Channels” in your bot and add channels for any interactions you want to support. In this case, I want to publish my bot to Teams. There aren’t really settings* for teams – just click to create the channel.

* You can publish a bot to the Microsoft App Source … but is your bot something that should be available to the Internet at large? It depends! If you’re writing a bot to provide enterprise customers another support avenue, having the bot available through App Source makes sense. If you’re creating a bot to answer employee-specific questions, then you probably want to keep the bot out of App Source

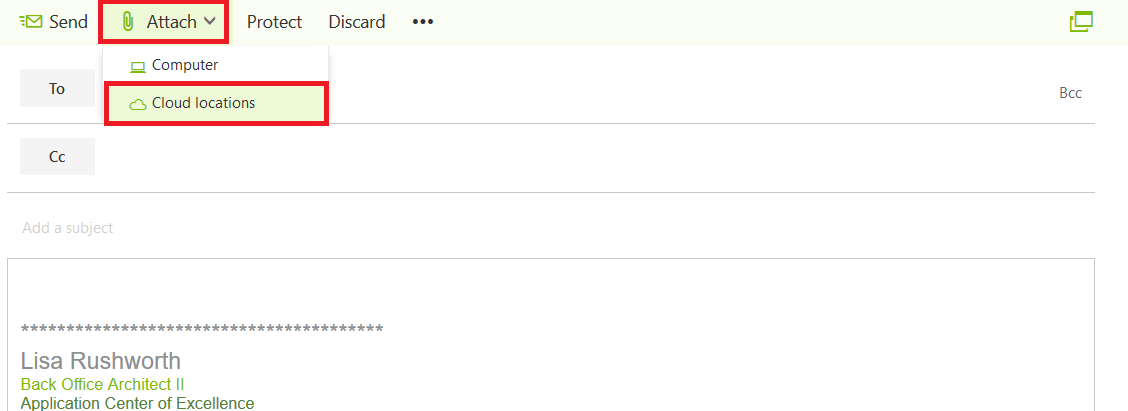
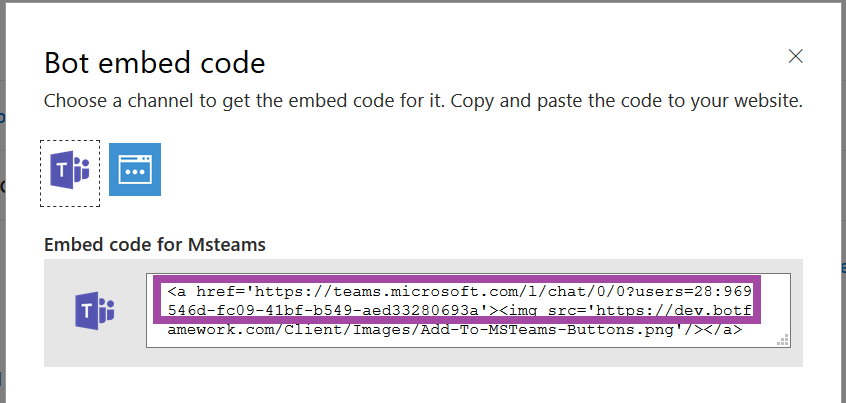
Once the channel has been created, click on the “Get bot embed codes” hyperlink to obtain the bot URL.

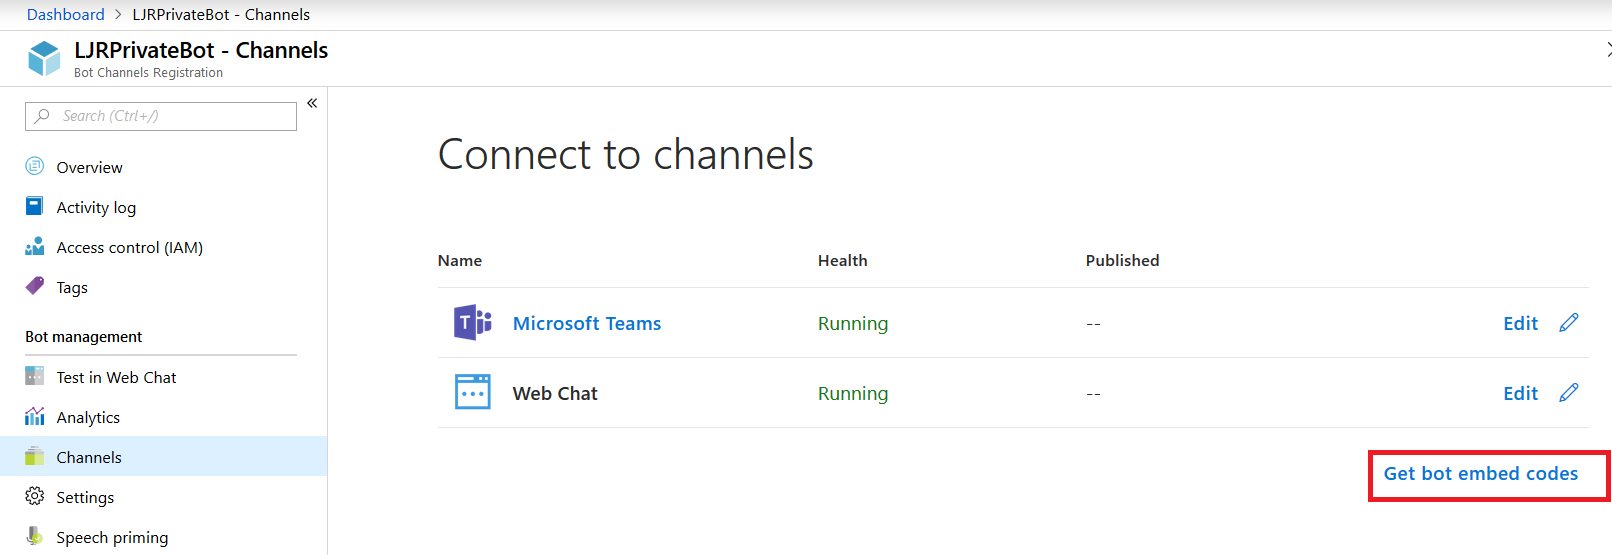
Individuals can use the hyperlink provided to add your bot to their Teams chat.

Ok, done! Except for one little thing – you need something to answer on that endpoint we entered earlier. You need a bot! Microsoft publishes an SDK and tools for building your bot in .NET, JavaScript, Python, and Java.

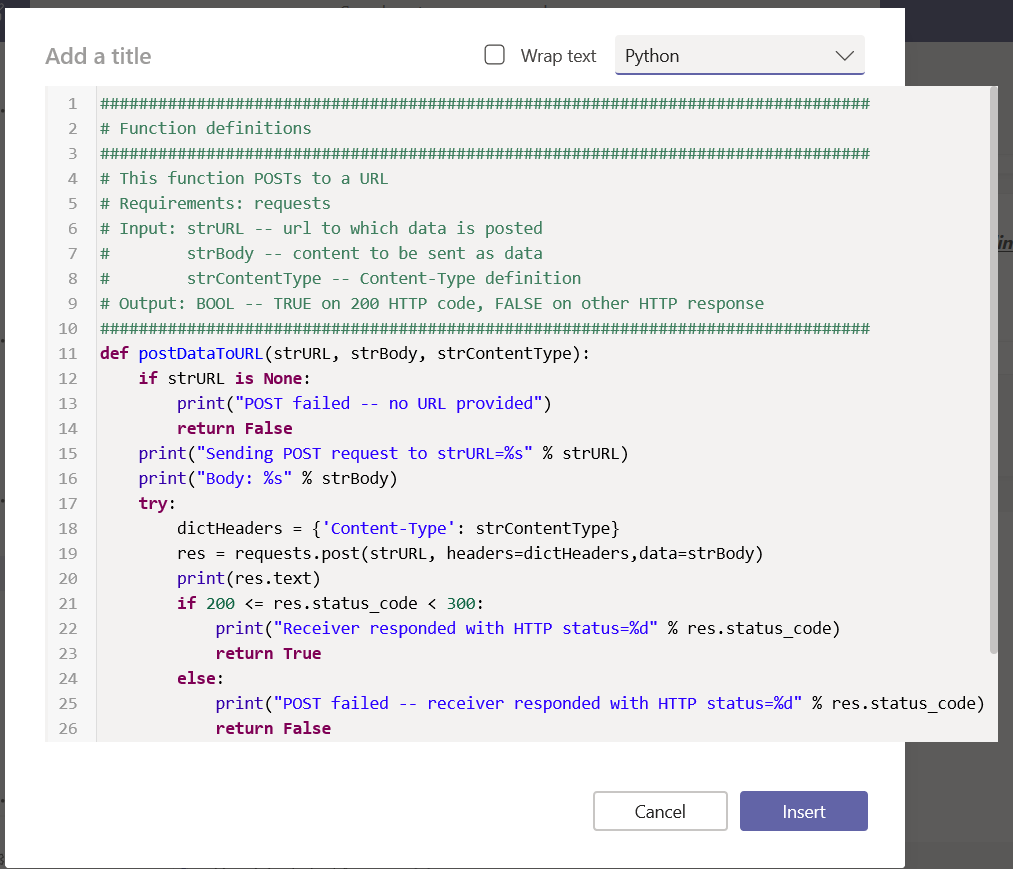
In this example, I am using a sample Python bot. For convenience, I am handling SSL on my reverse proxy instead of using an ssl wrapper in my Python service. Grab the BotBuilder package from git (https://github.com/Microsoft/botbuilder-python.git)

Install the stuff:

pip3 install -e ./libraries/botframework-connector

pip3 install -e ./libraries/botbuilder-schema

pip3 install -e ./libraries/botbuilder-core

pip3 install -r ./libraries/botframework-connector/tests/requirements.txt

In the ./samples/ folder, you’ll find a few beginner bots. Rich-Cards-Bot requires msrest that has some async functionality and the branch in requirements.txt doesn’t exist. Tried a few others and never got anything that worked properly. Same problem with EchoBot-with-State. I am using Echo-Connector-Bot because it doesn’t have this msrest problem, and I can add my own state support later.

Edit main.py and add your Azure bot application id & secret to APP_ID and APP_PASSWORD

APP_ID = ”

APP_PASSWORD = ”

PORT = 9000

SETTINGS = BotFrameworkAdapterSettings(APP_ID, APP_PASSWORD)

ADAPTER = BotFrameworkAdapter(SETTINGS)

I stash my personal information in a config.py file and added an import to main.py:

from config import strDBHostname, strDBUserName, strDBPassword, strDBDatabaseName, strDBTableName, APP_ID, APP_PASSWORD

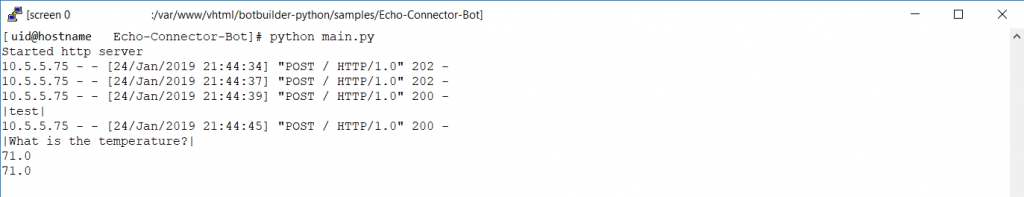
Tweak the code however you want – add natural language processing, make database connections to internal resources to determine responses, make calls to internal web APIs. I also added console output so I could debug bot operations.

When you’ve completed your changes, launch your bot by running “python main.py”

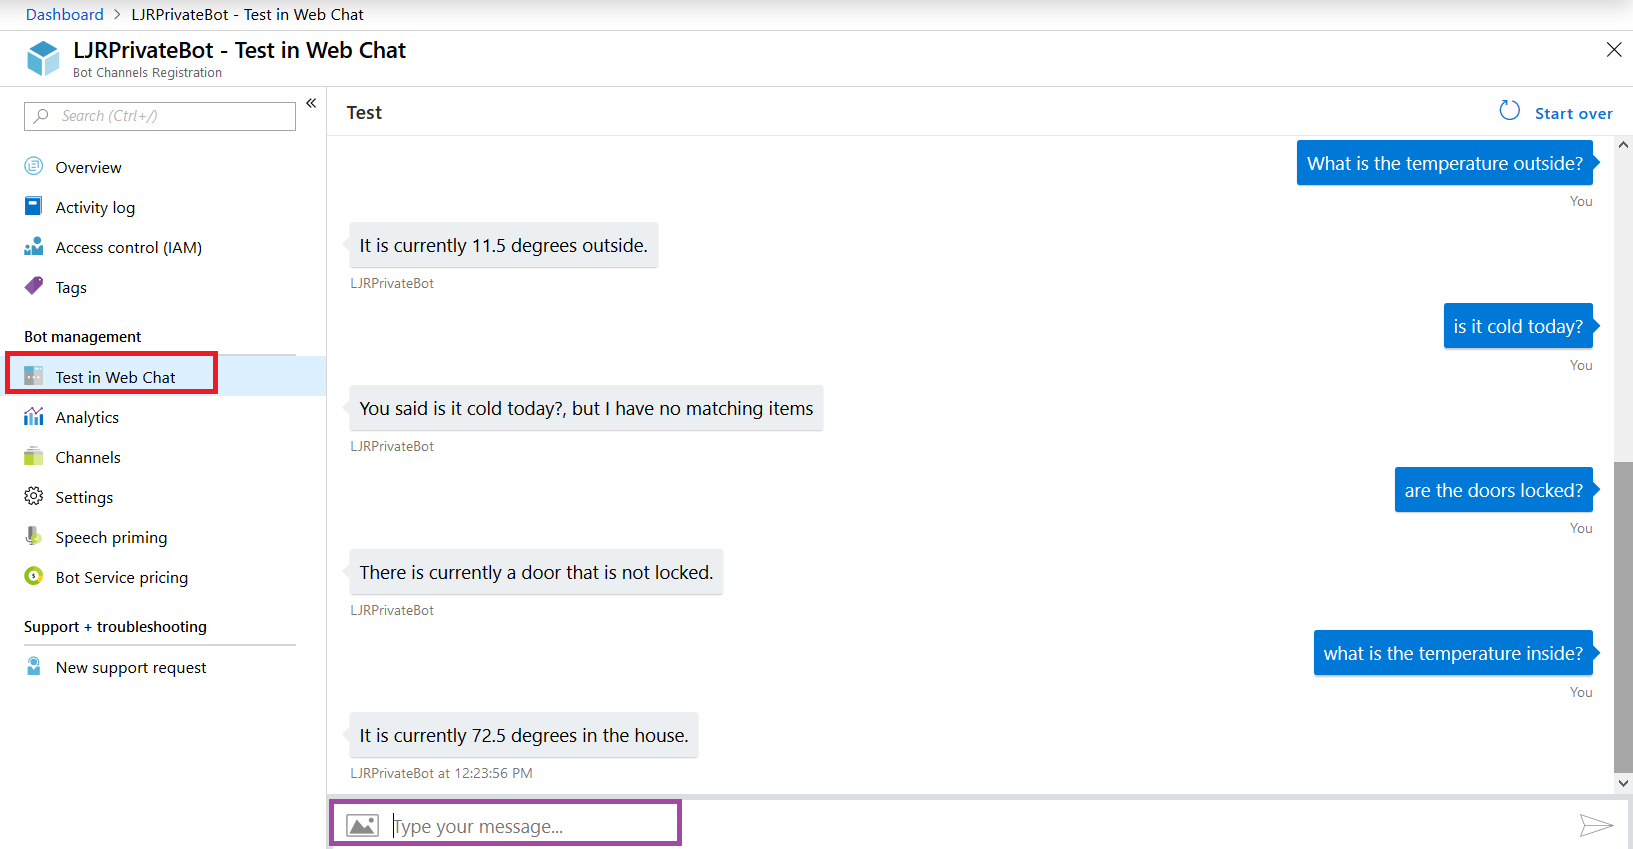
Now return to the Azure portal and select “Test in Web Chat” – this will allow you to test interactions with your bot. Ask questions – you should see your answers returned.

Once you confirm the bot is functioning properly, use the URL from the Teams channel to interact with your bot within Teams —

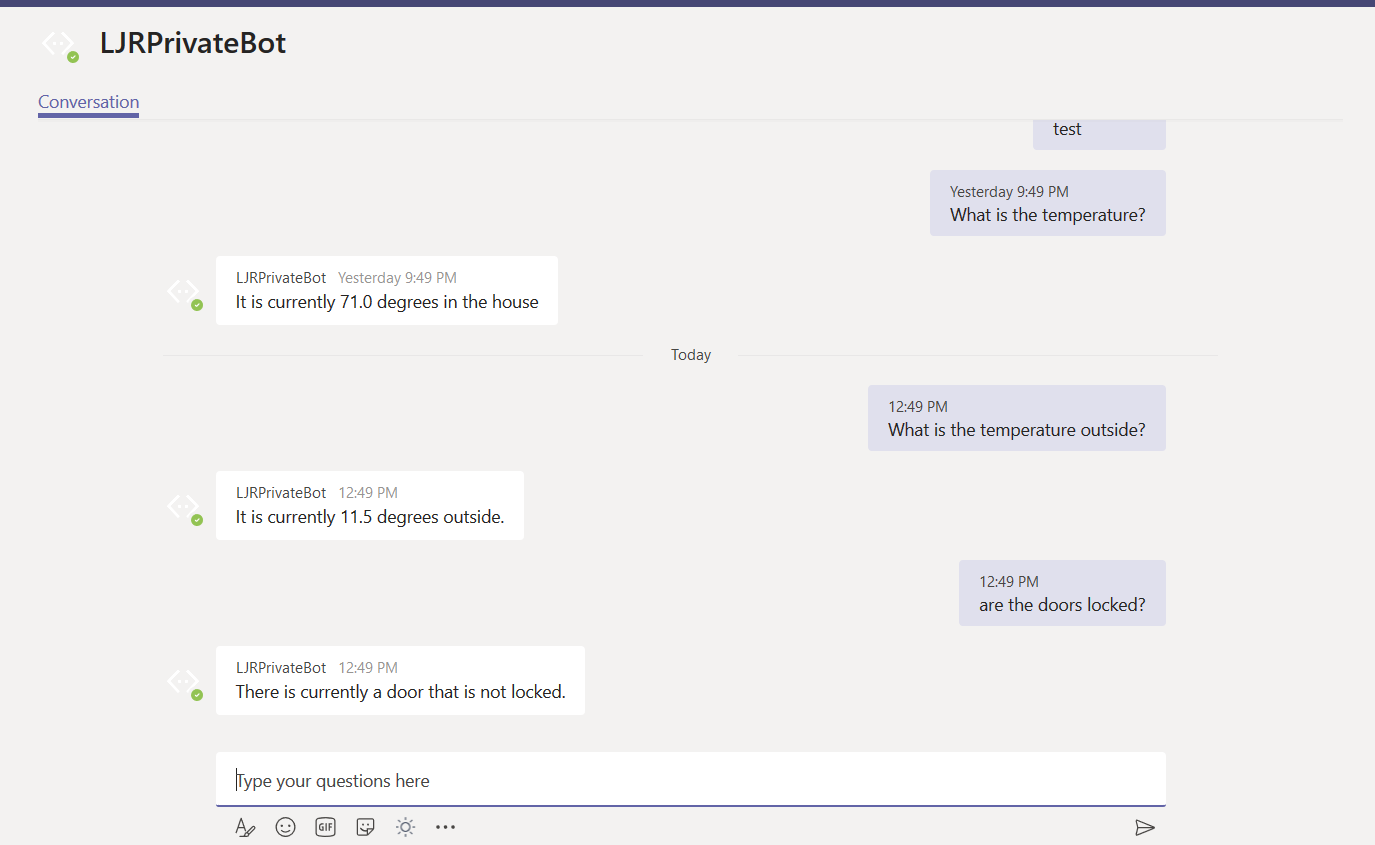
URL for my bot in Teams: https://teams.microsoft.com/l/chat/0/0?users=28:9699546d-fc09-41bf-b549-aed33280693a

The answer is served out of our home automation database – data that is only accessible on our private network.

Security – as I said earlier, you’ll probably want to take some measures to ensure access to your locally hosted bot is coming from legit sources. The app ID and secret provide one level of protection. If a connection does not supply the proper app ID & secret (or if you’ve mis-entered those values in your code!), you’ll get a 401 error.


But I don’t want the entire Internet DDoS’ing by bot either, and there is no reason for anyone outside of Microsoft Azure subnets should be accessing my locally hosted bot. My bot is hosted in a private container. The reverse proxy allows Internet-sourced traffic in to the private bot resource. Since communication from Azure will be sourced from a known set of networks, you can add a source IP restriction that prevents the general public from accessing your bot directly. See https://azurerange.azurewebsites.net/ for a convenient-to-use list of addresses.


Did you know … Microsoft Teams has a GUI text editor?

I like keeping my fingers on the keyboard, so I like using markdown in Teams messages (had to learn it for GitHub anyway!). The fact that hitting enter sends my posts in Teams? Generally awesome. I am not, however, the most succinct person; and a long series of thoughts is difficult to read as one continuous paragraph.

And using a new paragraph can serve to highlight a sentence without resorting to big bold text.

You can use shift-enter to move to a new line. Enter will still send your message.

But Teams has a GUI-driven composition mode — just click “Format” — that allows you to easily compose multi-line messages. In this editor, enter doesn’t send the message. It just moves the cursor to the next line.

There are a lot of formatting options available too. Basic typographical emphasis can be added to your text, and anything you type into the ‘Subject’ section will automatically be large, bold text.

The little highlighter icon will highlight text.

The underlined “A” changes the font color.

The icon with two A’s controls the text size.

So you can add really tiny or larger text.

Allowing you to use smaller or larger text.

You can create a bulleted list by clicking the icon with bulleted lines (or a numbered list by clicking the one with numbered lines). To end the list, either click the icon again or hit enter twice.

The quotation marks highlights text as a quote (two enters returns you to normal paragraph format here too), and hitting the drop-down next to “Paragraph” provides a list of pre-formatted text options.

A really cool feature for programmer-types – click the ‘code snipped’ icon.

A new composition window will be displayed – click the drop-down text to “Text” and select the programming language.

Text formatting will be applied to your code – the code I paste into Teams looks exactly like it does in my IDE.

When you have finished composing your message, you can click the little paper aeroplane to send your message. Or, if you prefer keeping your hands on the keyboard, hit ctrl-enter.


Did you know … Outlook can share OneDrive files for you?

Collaborative document editing in Teams and SharePoint is a huge time saver – instead of trying to merge multiple versions of a document together, we can all edit the same document (we can even edit it at the same time). OneDrive offers the same benefit, but it’s a bit of a hassle going into OneDrive, setting up sharing, and then sending people a link to the document. But Outlook handles this for you.

I have a private file saved to my OneDrive for Business space.

In your message, select ‘Attach’ and then ‘Cloud locations’.

You will see your OneDrive for Business files – select the file(s) that you want to share and click “Next”.

You will see the file as an attachment to the message – the OneDrive cloud logo lets you know that the ‘attachment’ is actually a link to a OneDrive document. Address and send the message as you normally would.

Check OneDrive again, and you will see that the document is shared.

The recipient will see an attachment to the message, and they will be able to view and edit the file.


Did you know … Excel can automatically highlight data for you?

Reading through large tables of data is inefficient – it’s time consuming, error prone, and just not a heap of fun. Graphs are one way to visualize data – allowing you to quickly spot trends, outliers, etc. Excel offers another way to visually enhance data to make it more comprehensible – conditional formatting. Where some charts and graphs obscure the underlying data, conditional formatting allows the exact value to be quickly identified.

Highlight your data. On the ribbon bar, select “Home” and click the drop-down for “Conditional Formatting”.

Select the logic to determine which cells are highlighted – we’ll go through a few examples here, but click around on your own! To highlight cells that are higher than some value, select “Highlight Cell Rules” and then select “Greater Than”.

In the window that appears, enter the number and select the colouring scheme. The prepopulated number will be the average of the highlighted data. The changes are applied as you select formatting options, so you have an idea what it’ll look like ahead of time. In this case, there are still a lot of values higher than 125. I could increase my number to reduce the number of highlighted cells. When you have finished composing your formatting rule, click OK.

And the format is applied to your data. You can apply multiple formats – add another format to turn anything below 25 green, make values between 100 and 124 yellow. Whatever you want.

If you need to change your formatting rules, click on the “Conditional Formatting” drop-down and select “Manage Rules”.

If your rules do not appear, change “Current Selection” at the top to “This Worksheet”.

You can also define custom rules. From the “Conditional Formatting” drop down, select “New Rule”.

Again, select the logic used to determine which cells are formatted. Here, I am highlighting duplicated values. Click “Format” to define how the highlighted cells should appear. Click “OK” to apply the formatting to your spreadsheet.

Now every duplicated record is in green with a strike through the value.

Formatting rules can be nuanced – here I am creating a custom formatting rule that uses a three-colour gradient based on where a value falls within a range.

Now you can quickly compare each value by it’s colour.


Bigger Bookbag for Anya — Interior

After cutting and laminating the fabric for the interior of Anya’s bookbag, I finally sewed it today. We still need to order the zipper online — we went to the craft store last week (and got caught in a snowstorm heading home!), but Anya’s zipper selection was only stocked in 9″. I’ll order the 22″ version online, and then we’ll have all of the bits and pieces to complete the bag.

Did you know … Excel can use maps to visualize data?

I remember visiting my uncle at a NASA design lab sometime in the mid-80’s – it was a huge cavernous room that he explained used to house the computer. A computer his graphing calculator could draw circles around. It was a powerful visual reminder how quickly computing technology advances – components are smaller, more powerful, and simpler to use.

More than two decades ago, I wrote a visualization application that presented a graphical representation of the geographic distribution of records. Which is a long way of saying it showed where something happened to a lot of people. The application was part of a cooperative effort between the FBI and local law enforcement – a data mining project meant to identify serial offenders across jurisdictional boundaries I wanted to be able to visualize where different types of crime were occurring and identify anomalies, so I built a program to do so. It took months to develop and took hours to crunch values and draw a map. The first time I used Excel to visualize frequency distribution on a map, I thought of that NASA computer room. What used to take a high-end Unix server with a RISC processor and tonnes (for the time) of memory – not to mention an entire summer of code development – is clickity-click and done on my little laptop. And the results are nicer:

How do you create this type of visualization? First you need data with something that is mappable – the example here is going to show the office locations listed in PeopleSoft. Click within the data set.

On the ribbon bar, select “Insert” then select “3D Map” in the “Tours” section.

If you have not used it before, you will be asked to enable data analysis service.

A new window will be displayed – select the column you want to map. Here, I am using zip codes, which is mapped to the “Postal Code” field in my spreadsheet. If your fields do not map automatically, you will need to click the drop-down next to a location data type and select the appropriate column.

There are different types of visualization – here, I have switched to a “heat map” where the color of the blob represents how many records fall into this zip code. It is a quick way of identifying clusters – hot spots.

You can control the look of the map as well – here, I have switched to a flat map and added location labels.

If you would like to include a copy of your map in another program – say, this Word document – select “Capture Screen” from the ribbon bar. You can also create a video to show an animated view of your map (zooming in on specific locations, rotating the globe to see people over in Mongolia)

After you’ve clicked “Screen Capture”, just paste and an image of your map will be inserted into your file – see!

Going A Little Farther:

Data isn’t perfect, and even when the data looks good it may not map properly. My sister used to live on a street in New Jersey that does not exist on a map. The post office affirmed it was the correct address, but UPS and FedEx claimed it didn’t exist. It was funny to me, but I wasn’t the one trekking two kids down to the neighbor on the main road who nicely accepted packages for her. She moved before they ever got the address situation sorted, but I’ve got first-hand experience with addresses that don’t map in some systems but are perfectly fine in others. Why do I mention this? The map visualization provides a “Mapping confidence” statistic – it is the percentage that appears above the box where you select the location data to be mapped. 98% is pretty good – there are a handful of records that don’t appear on the map … but the data I am presenting is a decent representation of our employee office locations. A low percentage would indicate that your map does not accurately convey your data.

What if my map confidence level is low? Click on the map confidence value to see what didn’t map. There are some marked with a result that is questionable – spot-checking them, 03109 is Manchester NH and 10001 is New York, NY. The one with no resolution, according to the US Postal Service lookup isn’t a valid postal code. If your data is wrong, fix it 😊 In cases where the data is right but the application isn’t confident about the location, you can add additional data to make the address more specific (here, I might increase the confidence by having the zip+4, or including the street address in my data set).

You can filter data in your map – first we’ll need some field on which to filter. Here, I’ve added the employee’s department to my data set.

On the right-hand pane, expand “Filters”. Click “Add filter”.

Select the column on which to filter data. A unique list of values will be presented – you can scroll through it or start typing the value to search. Once you find what you want to display, click the check-box before the value.

Now we are visualizing where people in my department work.

If your data is hard to see – records are distributed out fairly evenly across the map – you can increase the area of influence to make smaller clusters easier to identify. Scroll to the bottom of the right-hand pane and drag the “Radius of influence” slider to the right. If you have very clustered data, you can drag the slider to the left to turn a large red blob into a more nuanced visualization.

When you have finished visualizing your data, click “File” on the ribbon bar and select “Close”.


Moving A Microsoft Form Can Change The Form ID

Create a personal form at https://forms.office.com

Look at the form ID – it’s in the form URL

Now I’ve tested it & I’m ready to use it. I need to grant the rest of my team rights to modify the form. Click the fallen-over hamburger menu on the form

Select “Move”

Pick Teams space and click “Move”

Return to your Form – in the URL, look at the Form ID again. Compare it to the original … they don’t match!

Why do I mention this? Well, if you use a form in Flow … it is referenced by the form ID. Creating a personal form, building a workflow in flow, then moving the form to your Teams space to allow others to edit it breaks the workflow. When you go into the Flow to add additional owners, you’ll need to update the Form ID as well. If you don’t update your Flow, it will start failing. Oddly not at the initial “when a new response is submitted” step where I would expect it to fail if the Form ID was not valid but at the “get response details” step.

Looking at the error detail on “get response details”, the status code is 404 (HTTP error for ‘not found’, so I assumed it was used in the same context). The result body has an error code 639 which I couldn’t find anyone talking about online.