Month: July 2018

Kubernetes – Using Manifest Files To Deploy

While I’ve manually configured Kubernetes to create proof-of-concept sandbox systems, that is an inefficient approach for production systems. The kubectl create command can use a yaml file (or json, if you prefer that format). I maintain my manifests in a Git repository so changes can be tracked (and so I know where to find them!). Once you have a manifest, it’s a matter of using “kubectl create -f manifest1.yaml” or “kubectl create -f manifest1.yaml -f manifest2.yaml … -f manifestN.yaml” to bring the ‘stuff’ online.

But what goes into a manifest file? The following file would deploy four replicas of the sendmail container that is retained in my private registry.

If the namespaces have not been created,

apiVersion: v1
kind: Namespace
metadata:
  name: sendmailtest

The command “kubectl get ns” will list namespaces on the cluster. Note that ‘deployment’ items were not available in the v1 API, so the v1beta1 version needs to be specified to configure a deployment.

---
apiVersion: v1
kind: Pod
metadata:
  name: sendmail
  namespace: sendmailtest
  labels:
    app: sendmail
spec:
  containers:
    - name: sendmail
      image: sendmail
      ports:
        - containerPort: 25
---
apiVersion: v1beta1
kind: Deployment
metadata:
  name: sendmail
spec:
  replicas: 4
  template:
    metadata:
      labels:
        app: sendmail
    spec:
      containers:
        - name: sendmail
          image: 'rushworthdockerregistry/sendmail/sendmail/sendmail:latest'
          ports:
            - containerPort: 25

---
apiVersion: v1
kind: Service
metadata:
  name: sendmail-service
  labels:
    name: sendmail-service
spec:
  ports:
    - port: 25
      targetPort: 25
      protocol: TCP
      name: smtp
  selector:
    app: sendmail
  type: ClusterIP


Microservice Adoption

I worry that companies are deconstructing their monolithic applications into microservices because it’s trendy. In fact, there are places where microservices don’t make sense but rather impart additional complexity to an application that is not enhanced by the benefits of microservices. While some challenges to microservice adoption are transient or can be addressed through business decisions … some are fundamental aspects of the architecture.

Microservices are (relatively) new. Whereas a company that has built and run many monolithic applications has network, hypervisor, OS, deployment, and application experts … unless the company hires in a container orchestration / API gateway expert or brings in a consulting team (real world experience has been “learning it” was left up to employee initiative and the global archive of IT knowledge that is the Internet), there isn’t a deep knowledge base to support the framework. Not an insurmountable problem, and frankly no different than how virtualization was introduced — there weren’t hypervisor experts at the time, no one really understood sizing/scaling intricacies. It was learned, but the first 6-12 months were rough. High availability applications were physically designed to withstand failure. Our data centre has two unique circuits run to each rack – and dual power-supply servers are plugged into both the “A” and “B” circuits. Same with network – there’s a team that goes through two different switches. In switching to VM’s … we had to identify where this server runs (i.e. what is it’s host)? Is every component of a redundant system co-located on a single hypervisor or in SAN-booted VMs are they stored on a single SAN frame? Microservices will have a similar challenge — where is it running, can the service as a whole survive a fault? How do we recover from a major data centre failure?

Some of the places where I see microservices making development and operations more complex can be eliminated by business policies. Allowing individual service teams to dictate their own development language can reduce mobility between teams — the Java guru for service A will spend time researching the c# equiv if they move over work on service B. And while it is possible to publish a general coding standard that covers all languages (how variables will be named, what comment blocks should look like, etc) there are nuances to each language that make a shared standard impossible. Using multiple development languages limits employee mobility, and it also reduces a company’s ability to shift employees around to cover temporary resource shortfalls. While planned absences can be accounted for when selecting work for the next cycle, emergencies happen.

Breaking an application into small component services can create challenges in troubleshooting issues. There may be few who have an end-to-end understanding of the application. Where the monolithic application X getting munged information means the development team for App X needs to debug and sort the issue … ten interacting microservices can mean ten groups saying nothing’s wrong on their side and it’s everyone else’s problem. I’ve seen that occur frequently in infrastructure support — app guys says it is the server, server guy says it’s the hypervisor, hypervisor guy says it’s the SAN, SAN guy says it’s all good and someone should check with the network guys to see how those load balancers are doing.

Fundamentally, microservice architecture introduces additional components to run the application — the API gateway and container orchestration are functions that simply don’t exist in a monolithic application. These services themselves, as well as the supporting technologies that allow these services to function, add additional complexity.

As an example, the networking configuration behind making microservices available are not, in my experience, something with which developers are familiar. This is not a problem when dev teams require out-of-box functionality and said functionality is working properly. I became involved with container orchestration system because a friend’s dev team encountered failures where kube-proxy did not create the required iptables rules — a quick and easy thing for a Linux/Unix admin to identify and troubleshoot, but not something that concerned application developers in monolithic deployments. Since then, the dev team sought to use multiple network interfaces and the Kubernetes CNI plugin did not support that feature.

For an application where individual components have different utilization rates, microservice architecture makes sense. Thinking about a company that runs a major promotion. There will (hopefully) be a flood of customers browsing the web site. The components that handle browsing and search functions need to grow significantly. The component that handles existing user authentication, new user registration, customer checkout, inventory update, and shipping quote generation components don’t need to scale at the same level — only a fraction of the web traffic will actually convert to sales. So there’s no need to spin up new hosts in the web farm to handle users browsing product information.

For an application where individual components require frequent updates, microservice architecture makes sense. Is there a component that suffers frequent failures where having a pool of microservices available would increase the application’s uptime?

Kubernetes Sandbox With Minikube

A scaled down sandbox can be used to gain experience with the applications and techniques used to deploy containerized applications and microservices. This sandbox will be built on a Windows 10 laptop, but the same components can be run on Linux variants.

Prerequisites:

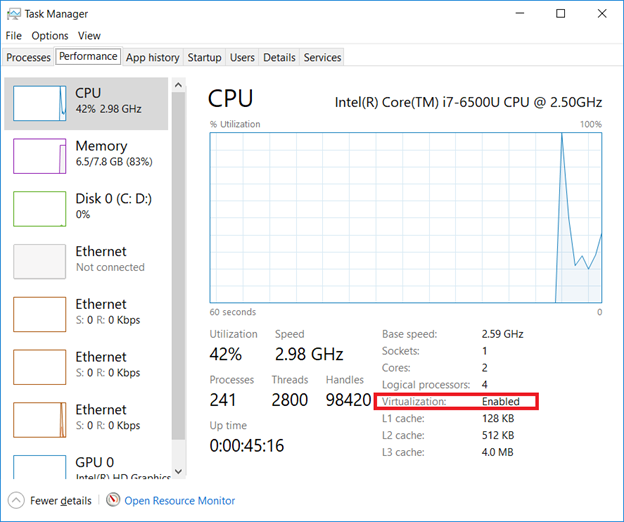
Verify Virtualization is enabled:

Open Task Manager (taskman.exe) and ensure the virtualization extensions have been enabled.

If virtualization is disabled, boot into the system config (start menu => settings => update & security => recovery, click “Restart now” under “Advanced startup”)

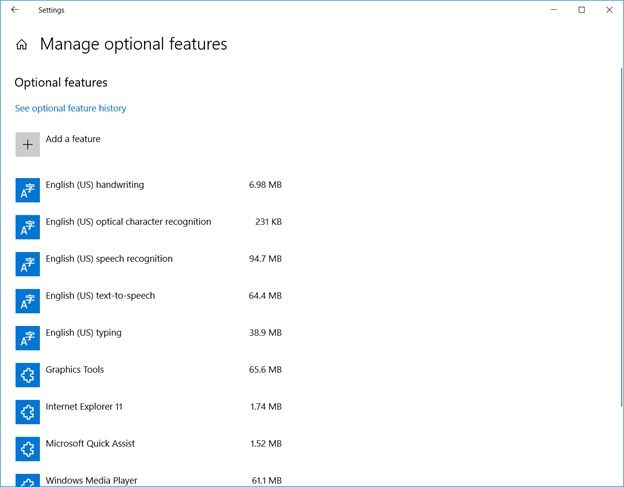
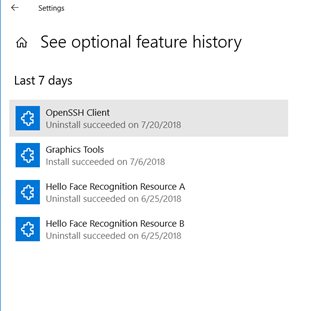
Uninstall the Windows OpenSSH client

Click ‘Start’ and type “Manage optional features” – within the installed feature list, find “OpenSSH Client”. If present, remove it.
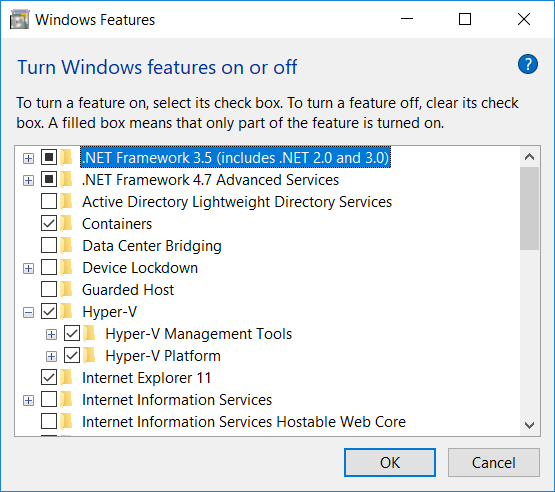
Enable Hyper-V

Enable the Hyper-V Windows feature (Control Panel => Programs => Programs and Features, “Turn Windows features on or off” and check both Hyper-V components).

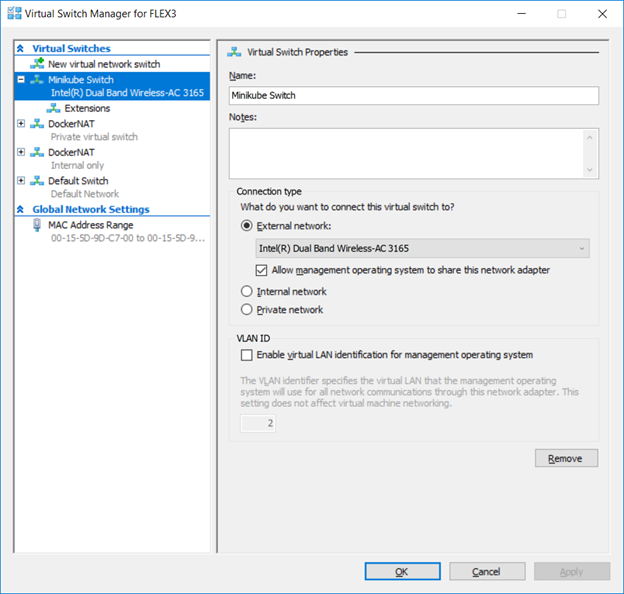
Add Virtual Switch To Hyper-V

In the Hyper-V Manager, open the “Virtual Switch Manager”. Create a new External virtual switch. Record the name used for your new virtual switch.


Install Minikube

View https://storage.googleapis.com/kubernetes-release/release/stable.txt and record the version number. The current stable release version is v1.11.1

Modify the URL http://storage.googleapis.com/kubernetes-release/release/v#.##.#/bin/windows/amd64/kubectl.exe to use the current stable release version. Current URL is http://storage.googleapis.com/kubernetes-release/release/v1.11.1/bin/windows/amd64/kubectl.exe

Create a folder %ProgramFiles%\Minikube and add this folder to your PATH variable.

Download kubectl.exe from the current release URL to %ProgramFiles%\Minikube

Download the current Minikube release from https://github.com/kubernetes/minikube/releases (scroll down to the “Distribution” section, locate the Windows/amd64 link, and save that binary as %ProgramFiles%\Minikube\minikube.exe). ** v0.28.1 was completely non-functional for me (and errors were related to existing issues on the minikube GitHub site) so I used v0.27.0

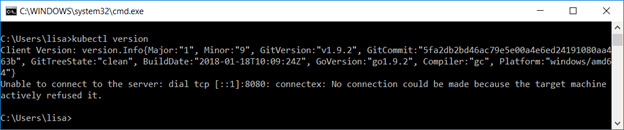
Verify both are functional. From a command prompt (run as administrator) or Powershell (again run as administrator), run “kubectl version” and verify the output includes a client version

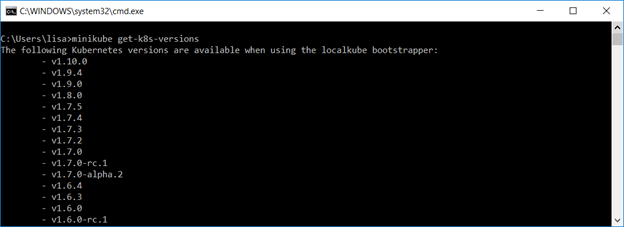
Run “minikube get-k8s-versions” and verify there is output.

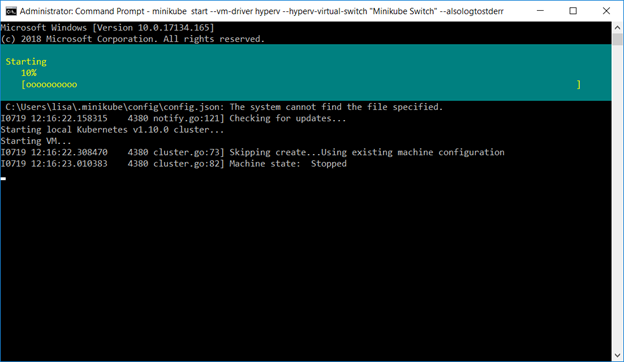
Configure the Minikube VM using the Hyper-V driver and switch you created earlier.

minikube start –vm-driver hyperv –hyperv-virtual-switch “Minikube Switch” –alsologtostderr

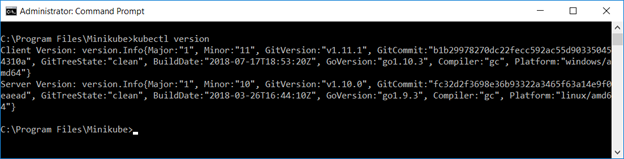
Once everything has started, “kubectl version” will report both a client and server version.

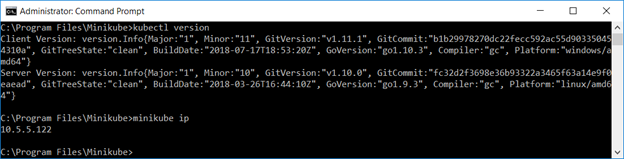
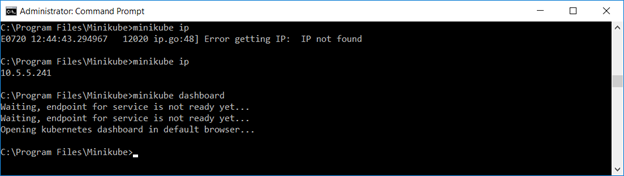
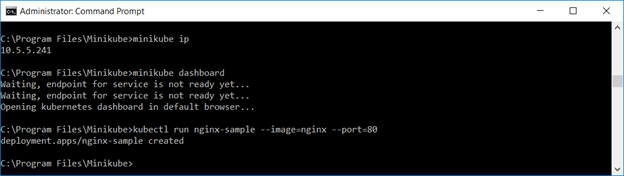
You can use “minikube ip” to ascertain the IP address of your cluster

If the cluster services fail to start, there are a few log locations.

Run “minikube logs” to see the log information from the minikube virtual machine

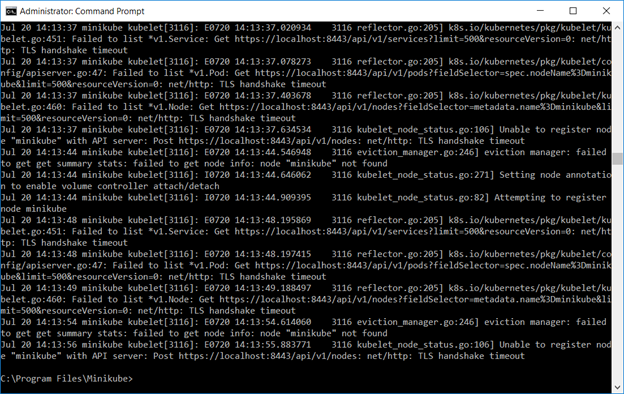
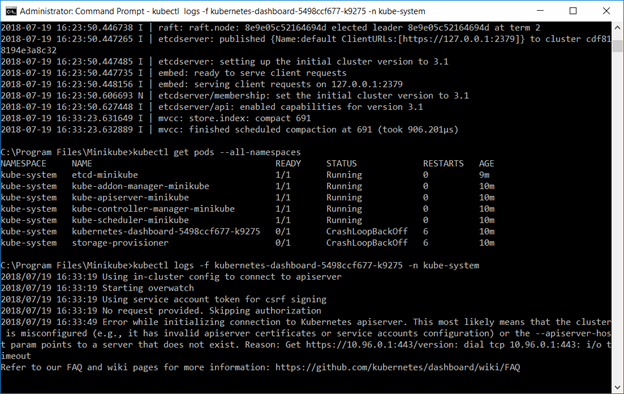
Use “kubectl get pods –all-namespaces” to determine which component(s) fail, then use “kubectl logs -f name -n kube-system” to review logs to determine why the component failed to start.

If you need to connect to the minikube Hyper-V VM, the username is docker and the password is tcuser – you can ssh into the host or connect to the console through the Hyper-V Manager.

Before the management interface comes online, you can use view the status of the containers using the docker command line utilities on the minikube VM.

$ docker ps

CONTAINER ID        IMAGE                        COMMAND                  CREATED              STATUS              PORTS               NAMES

7d8d66b5e465        af20925d51a3                 “kube-apiserver –ad…”   About a minute ago   Up About a minute                       k8s_kube-apiserver_kube-apiserver-minikube_kube-system_0f6076ada4273000c4b2f846f250f3f7_3

bb4be8d267cb        52920ad46f5b                 “etcd –advertise-cl…”   7 minutes ago        Up 7 minutes                            k8s_etcd_etcd-minikube_kube-system_0199781185b49d6ff5624b06273532ab_0

d6be5d6ae360        9c16409588eb                 “/opt/kube-addons.sh”    7 minutes ago        Up 7 minutes                            k8s_kube-addon-manager_kube-addon-manager-minikube_kube-system_3afaf06535cc3b85be93c31632b765da_1

b5ddf5d1ff11        ad86dbed1555                 “kube-controller-man…”   7 minutes ago        Up 7 minutes                            k8s_kube-controller-manager_kube-controller-manager-minikube_kube-system_d9cefa6e3dc9378ad420db8df48a9da5_0

252d382575c7        704ba848e69a                 “kube-scheduler –ku…”   7 minutes ago        Up 7 minutes                            k8s_kube-scheduler_kube-scheduler-minikube_kube-system_2acb197d598c4730e3f5b159b241a81b_0

421b2e264f9f        k8s.gcr.io/pause-amd64:3.1   “/pause”                 7 minutes ago        Up 7 minutes                            k8s_POD_kube-scheduler-minikube_kube-system_2acb197d598c4730e3f5b159b241a81b_0

85e0e2d0abab        k8s.gcr.io/pause-amd64:3.1   “/pause”                 7 minutes ago        Up 7 minutes                            k8s_POD_kube-controller-manager-minikube_kube-system_d9cefa6e3dc9378ad420db8df48a9da5_0

2028c6414573        k8s.gcr.io/pause-amd64:3.1   “/pause”                 7 minutes ago        Up 7 minutes                            k8s_POD_kube-apiserver-minikube_kube-system_0f6076ada4273000c4b2f846f250f3f7_0

663b87989216        k8s.gcr.io/pause-amd64:3.1   “/pause”                 7 minutes ago        Up 7 minutes                            k8s_POD_etcd-minikube_kube-system_0199781185b49d6ff5624b06273532ab_0

7eae09d0662b        k8s.gcr.io/pause-amd64:3.1   “/pause”                 7 minutes ago        Up 7 minutes                            k8s_POD_kube-addon-manager-minikube_kube-system_3afaf06535cc3b85be93c31632b765da_1


This allows you to view the specific logs for a container that is failing to launch

$ docker logs 0d21814d8226

Flag –admission-control has been deprecated, Use –enable-admission-plugins or –disable-admission-plugins instead. Will be removed in a future version.

Flag –insecure-port has been deprecated, This flag will be removed in a future version.

I0720 16:37:07.591352       1 server.go:135] Version: v1.10.0

I0720 16:37:07.596494       1 server.go:679] external host was not specified, using 10.5.5.240

I0720 16:37:08.555806       1 feature_gate.go:190] feature gates: map[Initializers:true]

I0720 16:37:08.565008       1 initialization.go:90] enabled Initializers feature as part of admission plugin setup

I0720 16:37:08.690234       1 plugins.go:149] Loaded 10 admission controller(s) successfully in the following order: NamespaceLifecycle,LimitRanger,ServiceAccount,NodeRestriction,DefaultTolerationSeconds,DefaultStorageClass,MutatingAdmissionWebhook,Initializers,ValidatingAdmissionWebhook,ResourceQuota.

I0720 16:37:08.717560       1 master.go:228] Using reconciler: master-count

W0720 16:37:09.383605       1 genericapiserver.go:342] Skipping API batch/v2alpha1 because it has no resources.

W0720 16:37:09.399172       1 genericapiserver.go:342] Skipping API rbac.authorization.k8s.io/v1alpha1 because it has no resources.

W0720 16:37:09.407426       1 genericapiserver.go:342] Skipping API storage.k8s.io/v1alpha1 because it has no resources.

W0720 16:37:09.445491       1 genericapiserver.go:342] Skipping API admissionregistration.k8s.io/v1alpha1 because it has no resources.

[restful] 2018/07/20 16:37:09 log.go:33: [restful/swagger] listing is available at https://10.5.5.240:8443/swaggerapi

[restful] 2018/07/20 16:37:09 log.go:33: [restful/swagger] https://10.5.5.240:8443/swaggerui/ is mapped to folder /swagger-ui/

[restful] 2018/07/20 16:37:52 log.go:33: [restful/swagger] listing is available at https://10.5.5.240:8443/swaggerapi

[restful] 2018/07/20 16:37:52 log.go:33: [restful/swagger] https://10.5.5.240:8443/swaggerui/ is mapped to folder /swagger-ui/


Worst case, we haven’t really done anything yet and you can start over with “minikube delete”, then delete the .minikube directory (likely located in %USERPROFILE%), and start over.

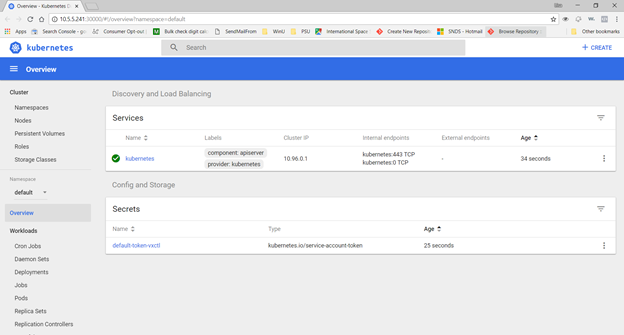
Once you have updated the Hyper-V configuration and started the cluster, you should be able to access the kubernetes dashboard

Actually using it

Now that you have minikube running, you can access the dashboard via a web URL – or just type “minikube dashboard” to have the site launched in your default browser.

Create a deployment – we’ll use the nginx sample image here

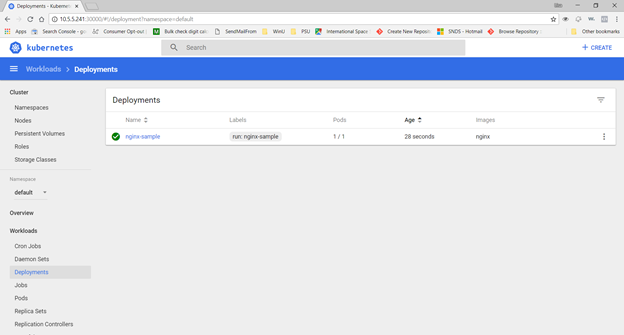
Voila, under Workloads => Deployments, you should see this test deployment (if the Pods column has 0/1, the image has not completely started … wait for it!)

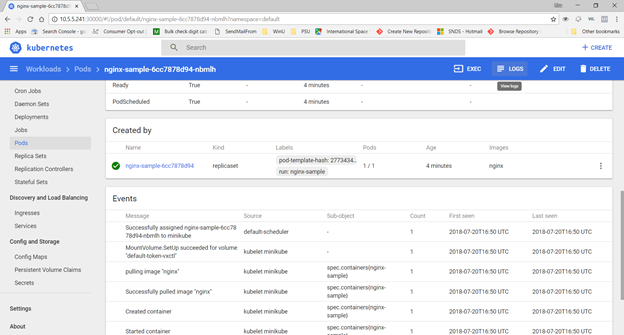
Under Workloads=>Pods, you can select the sample. In the upper right-hand corner, there are buttons to shell into the Pod as well as view logs from the Pod.

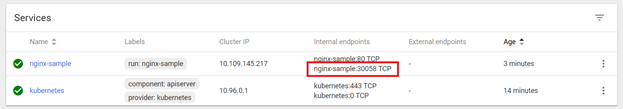
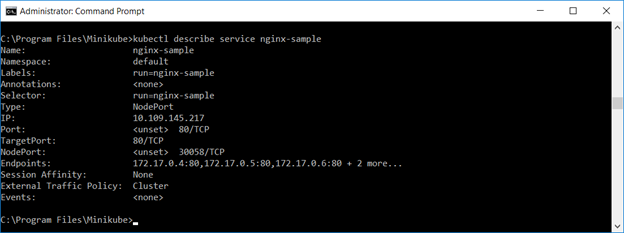
Expose the deployment as a service. You can use the web GUI to verify the service or “kubectl describe service servicename

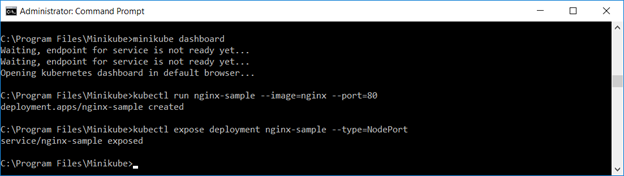
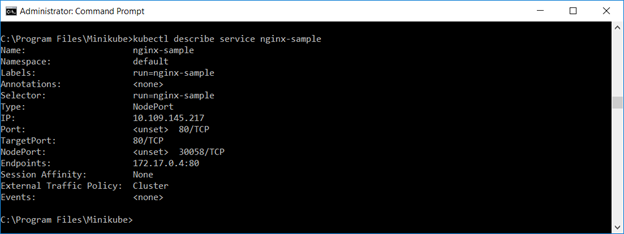
Either method provides the TCP port to access the service. Access the URL in a browser. Voila, a web site:

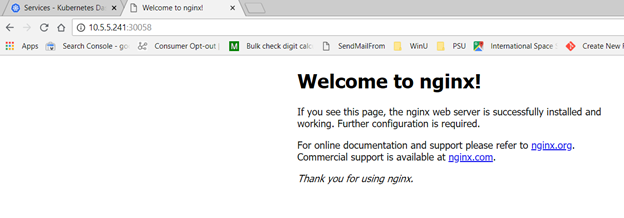
Viewing the Pod logs should now show the web server access logs.

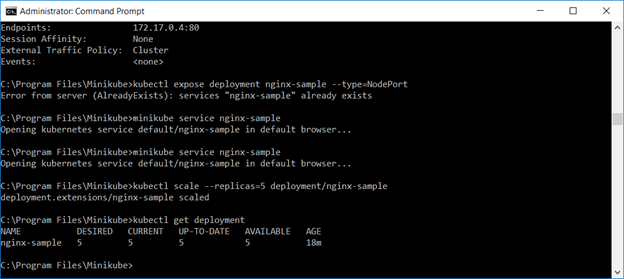
That’s all fine and good, but there are dozens of other ways to bring up a quick web server. Using Docker directly. Magic cloudy hosting services. A server with a web server on it. K8 allows you to quickly scale the deployment – specify the number of replicas you want and you’ve got them:

Describing the service, you will see multiple endpoints.

What do I really have?

You’ve got containers – either your own container for your application or some test container. Following these instructions, we’ve got a test container that serves up a simple web page.

You’ve got a Pod – one or more containers are run in a Pod. A pod exists on a single machine, so all containers within a Pod share resources. This is good thing if the containers interact with each other (shared resources speed up this communication), but it’s a bad thing if the containers have no correlation but run high I/O functions (shared resources create contention for this communication).

You’ve got a deployment – a managed group of Pods. Each application or microservice will have a deployment. The deployment keeps the desired number of instances running – if an instance is not healthy, it is terminated and a new instance spawned. You can resize the deployment on a schedule, or you can use load metrics to manage capacity.

You’ve got services – services map resources running within pods to internal or external access. The service has an IP address and port for client access, and requests are load balanced across healthy, running Pods. In our case, we are using NodePort, and “kubectl describe service ngnix-sample” will provide the port number.

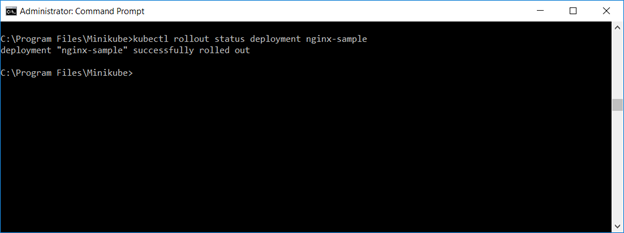
Because client access is performed through the service, you can perform “rolling updates” by setting a new image (and even roll back if the newly deployed image is malfunctioning). To roll a new image into service, use “kubectl set image deployments/ngnix-sample ngnix-sample=something/image:v5”. Using “kubectl get pods”, you can see replicas come online with the new image and ones with the old image terminate. Or, for a quick summary of the rollout status, run “kubectl rollout status deployment nginx-sample”

If the new container fails to load, or if adverse behavior is experienced, you can run “kubectl rollout undo deployment nginx-sample” to revert to the previous working container image.

When you are done with your sandbox, you can stop it using “minikube stop”, and “minikube start” will bring the sandbox back online.

A “real world” deployment would have multiple servers (physical, virtual, or a combination thereof) essentially serving as a resource pool. You wouldn’t manually scale deployments either.

Notice that the dashboard – and all of its administrative functions – are open to the world. A “real world” deployment would either include something like OpenUnison to authenticate through ADFS or some web hook that performs LDAP authentication and provides an access token.

And there’s no reason to use kubectl to manually deploy updates. Commit your changes into the git repository. Jenkins picks up the changes, runs the Maven build and tests, and creates a Docker build. The final step within the Jenkins workflow is to perform the image rollout. This means you can have a new image deployed within minutes (actual time depends on the build/test time) of committing code to a repo.

Today In Hyperbole

Overuse of hyperbole is an ineffective method of communicating. Our relationship with Russia is currently worse than, say, the Cuban Missile Crisis?!? Kids are not being run through fallout drills because they’re out of school for the summer, and duck-and-cover drills will resume in August?

Additionally “U.S. foolishness and stupidity” was, what, objecting to the occupation in the Crimea? Objecting to Russia supporting the gassing of Syrians? Oh, maybe imposing economic penalties on a bunch of what I assume to be old, rich, white dudes for Magnitsky’s death.

Visual Mathematics: Division

I’ve found a lot of worksheets for visualizing addition and subtraction, and even a few for multiplication. But I could not find any for division. To fill this gap, I made a quick cat themed division visualization worksheet for Anya.

For the problem X ÷ Y, there are X cats in the row below it. Circle groups of Y cats, and count the number of groups. If there are no cats “left over”, then you’ve got the answer. There is one with cats “left over” to introduce the idea of a remainder. Primarily, though, I wanted to focus on the idea of circling groups of Y and counting the groups to find the answer.

Quick and Easy Carrot Slaw

Ingredients:

  • 2 cups shredded carrots (about half a pound)
  • 2T Dijon mustard
  • 2T extra virgin olive oil
  • 1.5T red wine vinegar
  • 1t fresh orange zest (or 1/2 t Penzey’s Mural of Flavor)

Method:

  1. Combine the Dijon and vinegar, whisk to combine
  2. Slowly drizzle olive oil into mixture, whisking constantly
  3. Stir in zest or spice blend
  4. Stir in carrot shreds, making sure to coat the shreds evenly
  5. Cover in clingfilm and place in refrigerator to marinate for at least an hour
This recipe is a version of the Dijon carrot salad I ate during trips to Lyon and Geneva. It’s got a lot of Dijon, so you might want to start with half the amount and taste as you add more.

Powershell Credentials

I’ve only recently started using PowerShell to perform automated batch functions, and storing passwords in plain text is a huge problem. In other languages, I crypt the password with a string stored elsewhere, then use the elsewhere-stored string in conjunction with the cipher text to retrieve the password. There’s a really easy way to accomplish this in PowerShell (although it does not split the credential into two separate entities that force an attacker to obtain something from two places {i.e. reading a file on disk is good enough} but if they’re already reading my code and on my server … the attacker could easily repeat the algorithmic process of retrieving the other string … which is a long way to say the PowerShell approach may seem less secure; but, effectively, it isn’t much less secure)

The first step is to store the password into a file. Use “read-host -AsSecureString” to grab the password from user input, pipe that to convertfrom-securestring to turn it into a big ugly jumble of text, then pipe that out to a file

read-host -assecurestring | converfrom-securestring | out-file -filepath c:\temp\pass.txt

View the content of the file and you’ll see … a big long hex thing

Great, I’ve got a bunch of rubbish in a file. How do I use that in a script? Set a variable to the content of the file piped through convertto-securestring and then use that password to create a new PSCredential object

$strPassword = get-content -path c:\temp\pass.txt | convertto-securestring
$cred = new-object -typename PSCredential -argumentlist ‘UserID’,$strPassword

Voila, $cred is a credential that you can use in other commands.

New Git Server

I love GitLab, but it’s resource intensive and I wasn’t able to run it on the current hardware. Getting a new server has been a slow process, so I needed another solution. We use the Bonobo Git Server at work — it’s really simple and doesn’t provide all of the analysis and workflow functionality of GitLab (e.g. there are no pull requests!) … but it does keep revisions of code to which you can revert. And that’s better than trying to figure out what changed and broke a program. So I set one up at home.

Super simple — except they forget a few steps — like they don’t mean you need to install .NET 4.6. You need to go in the Add Roles & Features, under Application Development Features, and enable ASP.NET. 4.5 worked fine for me. You’ve also got to restart your IIS MMC if you left it running, and change the application pool over to one that actually uses ASP.NET.

Once that was installed, a few quick changes to web.config enabled AD-based authentication. And now we’ve got a git server at home that I can leave running 24×7.

Except … I tried using a new git server and got the following error:
schannel: next InitializeSecurityContext failed: Unknown error (0x80092012) –
The revocation function was unable to check revocation for the certificate.

To resolve the issue, I needed to changed from Windows to OpenSSL certificate handling:
git config –global http.sslBackend openssl

Except that blew away my config line that defines the SSL CA CRT file. Once I restored my configuration … voila, I can use the git client with my new git server
git config –system http.sslcainfo “c:\Program Files\Git\mingw64\ssl\certs\ca-bundle.crt”

Sorting Grep Results When Log File Names Are Incremented Integers

While rotated log files can have a timestamp like YYYYMMDDHHmmss appended, a lot of log files are rotated with incremented integers (i.e. file.3 is removed, file.2 becomes file.3, file.1 becomes file.2, file becomes file.1, and file is a new file for current log ‘stuff’). We had some … challenges changing the log4j settings to use the timestamp format. When you grep all of the log files, the results are organized by alpha-sorted file names. Problem is that alpha sorted file names are 1, 10, 11, 12, …, 19, 2, 20, 21 … which doesn’t produce results in ascending or descending date order. You get:

zwave.log.1:2018-07-01 22:51:21.450 [DEBUG] [ng.zwave.internal.protocol.ZWaveTransactionManager] – NODE 58: Node not awake!
zwave.log.1:2018-07-01 22:51:21.450 [DEBUG] [ng.zwave.internal.protocol.ZWaveTransactionManager] – NODE 55: Node not awake!
zwave.log.11:2018-07-02 00:47:05.375 [DEBUG] [ng.zwave.internal.protocol.ZWaveTransactionManager] – NODE 70: Node not awake!
zwave.log.11:2018-07-02 00:47:05.376 [DEBUG] [ng.zwave.internal.protocol.ZWaveTransactionManager] – NODE 46: Node not awake!
zwave.log.12:2018-07-02 01:01:12.850 [DEBUG] [ng.zwave.internal.protocol.ZWaveTransactionManager] – NODE 82: Node not awake!
zwave.log.13:2018-07-02 01:11:22.465 [DEBUG] [ng.zwave.internal.protocol.ZWaveTransactionManager] – NODE 48: Node not awake!
zwave.log.13:2018-07-02 01:11:22.478 [DEBUG] [ng.zwave.internal.protocol.ZWaveTransactionManager] – NODE 82: Node not awake!
zwave.log.13:2018-07-02 01:11:22.478 [DEBUG] [ng.zwave.internal.protocol.ZWaveTransactionManager] – NODE 49: Node not awake!
zwave.log.14:2018-07-02 01:25:22.632 [DEBUG] [ng.zwave.internal.protocol.ZWaveTransactionManager] – NODE 112: Node not awake!
zwave.log.14:2018-07-02 01:25:22.632 [DEBUG] [ng.zwave.internal.protocol.ZWaveTransactionManager] – NODE 212: Node not awake!
zwave.log.15:2018-07-02 01:40:29.053 [DEBUG] [ng.zwave.internal.protocol.ZWaveTransactionManager] – NODE 58: Node not awake!
zwave.log.15:2018-07-02 01:40:29.053 [DEBUG] [ng.zwave.internal.protocol.ZWaveTransactionManager] – NODE 70: Node not awake!
zwave.log.16:2018-07-02 01:55:01.702 [DEBUG] [ng.zwave.internal.protocol.ZWaveTransactionManager] – NODE 50: Node not awake!
zwave.log.16:2018-07-02 01:55:01.702 [DEBUG] [ng.zwave.internal.protocol.ZWaveTransactionManager] – NODE 122: Node not awake!
zwave.log.17:2018-07-02 02:08:48.818 [DEBUG] [ng.zwave.internal.protocol.ZWaveTransactionManager] – NODE 67: Node not awake!
zwave.log.17:2018-07-02 02:08:48.818 [DEBUG] [ng.zwave.internal.protocol.ZWaveTransactionManager] – NODE 212: Node not awake!
zwave.log.18:2018-07-02 02:23:53.281 [DEBUG] [ng.zwave.internal.protocol.ZWaveTransactionManager] – NODE 55: Node not awake!
zwave.log.18:2018-07-02 02:23:53.281 [DEBUG] [ng.zwave.internal.protocol.ZWaveTransactionManager] – NODE 46: Node not awake!
zwave.log.19:2018-07-02 02:44:23.567 [DEBUG] [ng.zwave.internal.protocol.ZWaveTransactionManager] – NODE 48: Node not awake!
zwave.log.19:2018-07-02 02:44:23.567 [DEBUG] [ng.zwave.internal.protocol.ZWaveTransactionManager] – NODE 86: Node not awake!
zwave.log.19:2018-07-02 02:44:23.567 [DEBUG] [ng.zwave.internal.protocol.ZWaveTransactionManager] – NODE 50: Node not awake!
zwave.log.2:2018-07-01 23:03:36.704 [DEBUG] [ng.zwave.internal.protocol.ZWaveTransactionManager] – NODE 57: Node not awake!
zwave.log.2:2018-07-01 23:03:36.704 [DEBUG] [ng.zwave.internal.protocol.ZWaveTransactionManager] – NODE 64: Node not awake!
zwave.log.2:2018-07-01 23:03:36.704 [DEBUG] [ng.zwave.internal.protocol.ZWaveTransactionManager] – NODE 68: Node not awake!

So I put together a quick sequence of commands that will produce results sorted by date. This process strips off the file names (I could create a more complex command set to shuffle the file name off to the end, but I didn’t need the file name. I just needed to scroll through the times at which an event occurred).

grep “Node not awake” zwave.log* | sed -r ‘s/^zwave.log.*:2018/2018/’ | sort

The grep results are piped to sed to have the file name prefix removed. The subsequent results are then piped to sort to be, well, sorted.