General Info
Logstash is a pipeline based data processing service. Data comes into logstash, is manipulated, and is sent elsewhere. The source is maintained on GitHub by ElasticCo.
Installation
Logstash was downloaded from ElasticCo and installed from a gzipped tar archive to the /opt/elk/logstash folder.
Configuration
The Logstash server is configured using the logstash.yml file.
Logstash uses Log4J 2 for logging. Logging configuration is maintained in the log4j2.properties file
Logstash is java-based, and the JVM settings are maintained in the jvm.options file – this includes min heap space, garbage collection configuration, JRuby settings, etc.
Logstash loads the pipelines defined in /opt/elk/logstash/config/pipelines.yml – each pipeline needs an ID and a path to its configuration. The path can be to a config file or to a folder of config files for the pipeline. The number of workers for the pipeline defaults to the number of CPUs, so we normally define a worker count as well – this can be increased as load dictates.
– pipeline.id: LJR
pipeline.workers: 2
path.config: “/opt/elk/logstash/config/ljr.conf”
Each pipeline is configured in an individual config file that defines the input, any data manipulation to be performed, and the output.
Testing Configuration
As we have it configured, you must reload Logstash to implement any configuration changes. As errors in pipeline definitions will prevent the pipeline from loading, it is best to test the configuration prior to restarting Logstash.
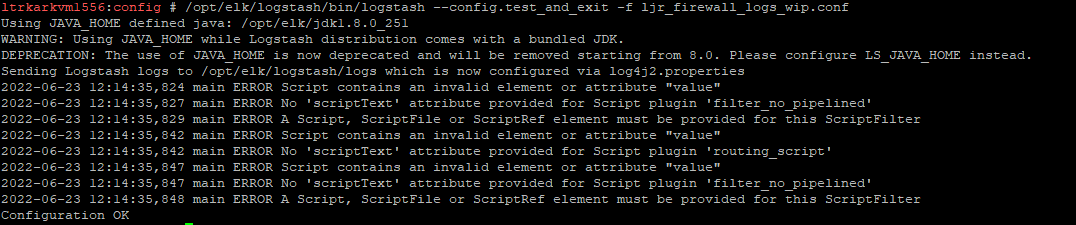
/opt/elk/logstash/bin/logstash –config.test_and_exit -f ljr_firewall_logs_wip.conf
Some errors may occur – if the test ends with “Configuration OK”, then it’s OK!
Automatic Config Reload
The configuration can automatically be reloaded when changes to config files are detected. This doesn’t give you the opportunity to test a configuration prior to it going live on the server (once it’s saved, it will be loaded … or not loaded if there’s an error)
Input
Input instructs logstash about what format data the pipeline will receive – is JSON data being sent to the pipeline, is syslog sending log data to the pipeline, or does data come from STDIN? The types of data that can be received are defined by the input plugins. Each input has its own configuration parameters. We use Beats, syslog, JSON (a codec, not a filter type), Kafka, stuff
The input configuration also indicates which port to use for the pipeline – this needs to be unique!
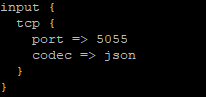
Input for a pipeline on port 5055 receiving JSON formatted data
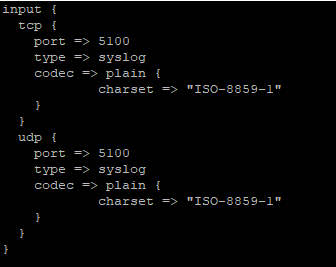
Input for a pipeline on port 5100 (both TCP and UDP) receiving syslog data
Output
Output is similarly simple – various output plugins define the systems to which data can be shipped. Each output has its own configuration parameters – ElasticSearch, Kafka, and file are the three output plug-ins we currently use.
ElasticSearch
Most of the data we ingest into logstash is processed and sent to ElasticSearch. The data is indexed and available to users through ES and Kibana.
Kafka
Some data is sent to Kafka basically as a holding queue. It is then picked up by the “aggregation” logstash server, processed some more, and relayed to the ElasticSearch system.
File
File output is generally used for debugging – seeing the output data allows you to verify your data manipulations are working property (as well as just make sure you see data transiting the pipeline without resorting to tcpdump!).
Filter
Filtering allows data to be removed, attributes to be added to records, and parses data into fields. The types of filters that can be applied are defined by the filter plugins. Each plugin has its own documentation. Most of our data streams are filtered using Grok – see below for more details on that.
Conditional rules can be used in filters. This example filters out messages that contain the string “FIREWALL”, “id=firewall”, or “FIREWALL_VRF” as the business need does not require these messages, so there’s no reason to waste disk space and I/O processing, indexing, and storing these messages.

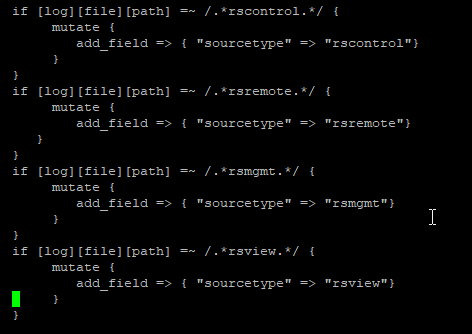
This example adds a field, ‘sourcetype’, with a value that is based on the log file path.
Grok
The grok filter is a Logstash plugin that is used to extract data from log records – this allows us to pull important information into distinct fields within the ElasticSearch record. Instead of having the full message in the ‘message’ field, you can have success/failure in its own field, the logon user in its own field, or the source IP in its own field. This allows more robust reporting. If the use case just wants to store data, parsing the record may not be required. But, if they want to report on the number of users logged in per hour or how much data is sent to each IP address, we need to have the relevant fields available in the document.
Patterns used by the grok filter are maintained in a Git repository – the grok-patterns contains the data types like ‘DATA’ in %{DATA:fieldname}
The following are the ones I’ve used most frequently:
| Name |
Field Type |
Pattern Notes |
Notes |
| DATA |
Text data |
.*? |
This does not expand to the most matching characters – so looking for foo.*?bar in “foobar is not really a word, but foobar gets used a lot in IT documentation” will only match the bold portion of the text |
| GREEDYDATA |
Text data |
.* |
Whereas this matches the most matching characters – so foo.*bar in “foobar is not really a word, but foobar gets used a lot in IT documentation” matches the whole bold portion of the text |
| IPV4 |
IPv4 address |
|
|
| IPV6 |
IPv6 address |
|
|
| IP |
IP address – either v4 or v6 |
(?:%{IPV6}|%{IPV4}) |
This provides some flexibility as groups move to IPv6 – but it’s a more complex filter, so I’ve been using IPV4 with the understanding that we may need to adjust some parsing rules in the future |
| LOGLEVEL |
Text data |
|
Regex to match list of standard log level strings – provides data validation over using DATA (i.e. if someone sets their log level to “superawful”, it won’t match) |
| SYSLOGBASE |
Text data |
|
This matches the standard start of a syslog record. Often used as “%{SYSLOGBASE} %{GREEDYDATA:msgtext}” to parse out the timestamp, facility, host, and program – the remainder of the text is mapped to “msgtext” |
| URI |
Text data |
|
protocol://stuff text is parsed into the protocol, user, host, path, and query parameters |
| INT |
Numeric data |
(?:[+-]?(?:[0-9]+)) |
Signed or unsigned integer |
| NUMBER |
Numeric data |
|
Can include a casting like %{NUMBER:fieldname;int} or %{NUMBER:fieldname;float} |
| TIMESTAMP_ISO8601 |
DateTime |
%{YEAR}-%{MONTHNUM}-%{MONTHDAY}[T ]%{HOUR}:?%{MINUTE}(?::?%{SECOND})?%{ISO8601_TIMEZONE}? |
There are various other date patterns depending on how the string will be formatted. This is the one that matches YYYYMMDDThh:mm:ss |
Parsing an entire log string
In a system with a set format for log data, parsing the entire line is reasonable – and, often, there will be a filter for well-known log types. I.E. if you are using the default Apache HTTPD log format, you don’t need to write a filter for each component of the log line – just match either the HTTPD_COMBINEDLOG or HTTPD_COMMONLOG pattern.
match => { “message” => “%{HTTPD_COMMONLOG}” }
But you can create your own filter as well – internally developed applications and less common vendor applications won’t have prebuilt filter rules.
match => { “message” => “%{TIMESTAMP_ISO8601:logtime} – %{IPV4:srcip} – %{IPV4:dstip} – %{DATA:result}” }
Extracting an array of data
Instead of trying to map an entire line at once, you can extract individual data elements by matching an array of patterns within the message.
match => { “message” => [“srcip=%{IPV4:src_ip}”
, “srcport=%{NUMBER:srcport:int}”
,”dstip=%{IPV4:dst_ip}”
,”dstport=%{NUMBER:dstport:int}”] }
This means the IP and port information will be extracted regardless of the order in which the fields are written in the log record. This also allows you to parse data out of log records where multiple different formats are used (as an example, the NSS Firewall logs) instead of trying to write different parsers for each of the possible string combinations.
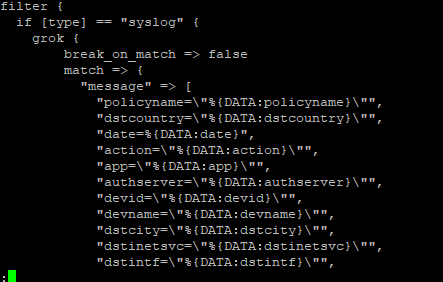
Logstash, by default, breaks when a match is found. This means you can ‘stack’ different filters instead of using if tests. Sometimes, though, you don’t want to break when a match is found – maybe you are extracting a bit of data that gets used in another match. In these cases, you can set break_on_match to ‘false’ in the grok rule.
I have also had to set break_on_match when extracting an array of values from a message.
Troubleshooting
Log Files
Logstash logs output to /opt/elk/logstash/logs/logstash-plain.log – the logging level is defined in the /opt/elk/logstash/config/log4j2.properties configuration file.
Viewing Data Transmitted to a Pipeline
There are several ways to confirm that data is being received by a pipeline – tcpdump can be used to verify information is being received on the port. If no data is being received, the port may be offline (if there is an error in the pipeline config, the pipeline will not load – grep /opt/elk/logstash/logs/logstash-plain.log for the pipeline name to view errors), there may be a firewall preventing communication, or the sender could not be transmitting data.
tcpdump dst port 5100 -vv
If data is confirmed to be coming into the pipeline port, add a “file” output filter to the pipeline.
Issues
Data from filebeat servers not received in ElasticSearch
We have encountered a scenario were data from the filebeat servers was not being transmitted to ElasticSearch. Monitoring the filebeat server did not show any data being sent. Restarting the Logstash servers allowed data to be transmitted as expected.