Setting up a Neo4J Database
Ostensibly, you can create a new database using “create database somethingorother”. However, that is if you are using the enterprise edition. Running the community edition, you can only run one database. Attempting to create a new database will produce an error indicating Neo.ClientError.Statement.UnsupportedAdministrationCommand
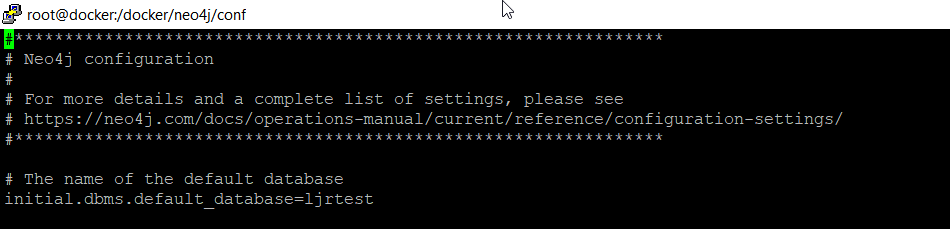
To use a database with a custom name, I need to edit neo4j.conf and set initial.dbms.default_database
Then create a Docker container – I am mapping /data to an external directory to persist my data and /var/lib/neo4j/conf to an external directory to persist configuration
docker run -dit --name neo4j --publish=7474:7474 --publish=7687:7687 --env=NEO4J_AUTH=none --volume=/docker/neo4j/data:/data --volume=/docker/neo4j/conf:/var/lib/neo4j/conf neo4j
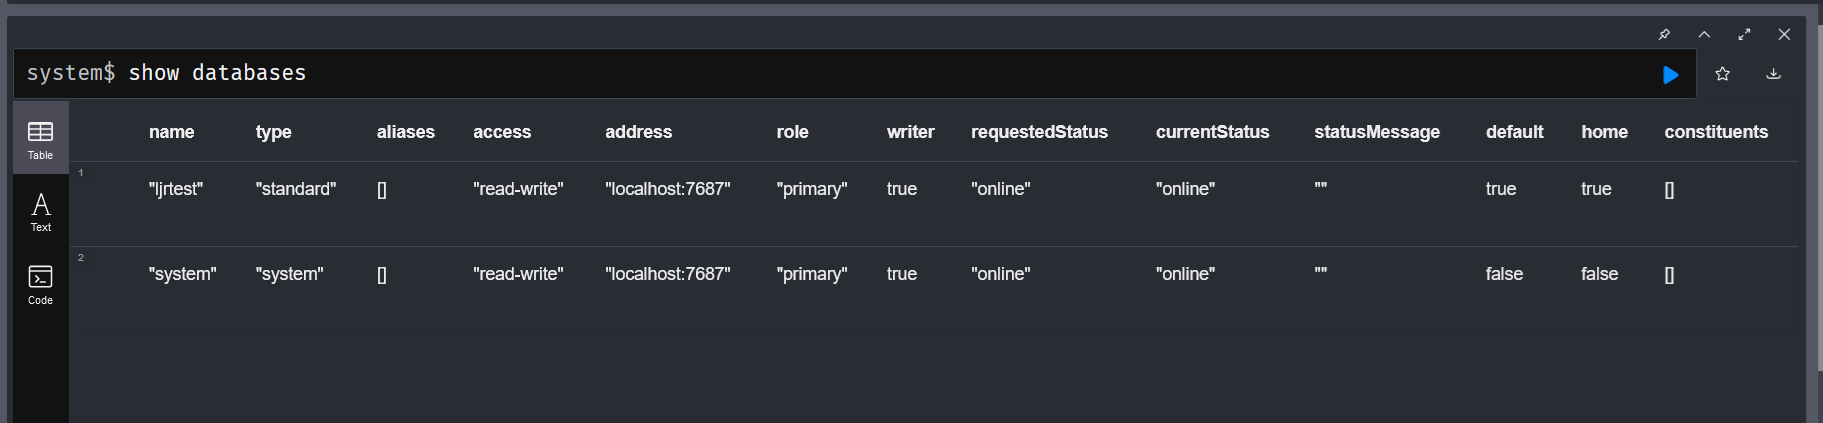
Listing the databases using “show databases” will show my custom database name
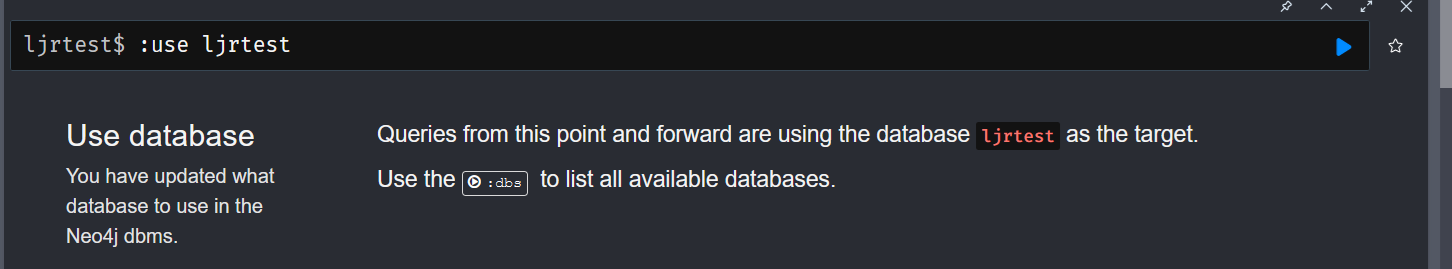
Switch to our database with the “:use” instruction
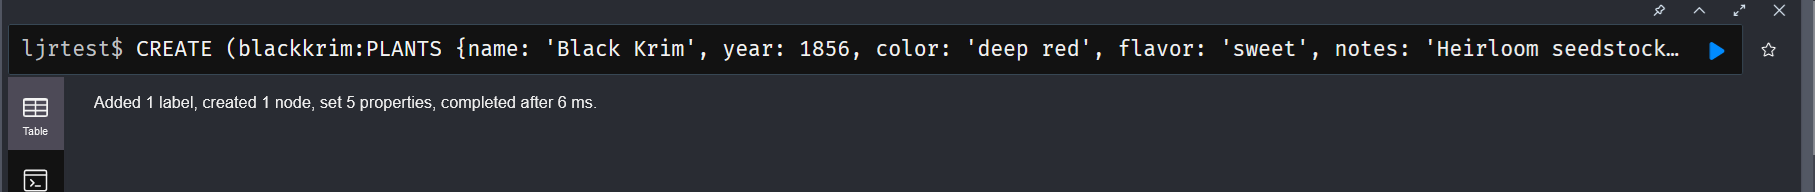
Create single nodes
CREATE (:PLANTS {name: ‘Black Krim’, year: 1856, color: ‘deep red’, flavor: ‘sweet’, notes: ‘Heirloom seedstock’})
Note: After I started using my data, I realized that “PLANTS” is a silly label to use since they will all be plants. I recreated all of my data with nodes labeled “TOMATO” so I can also track peppers, daffodils, and any other plants we start hybridizing.
Load of all records:
CREATE(:TOMATO {flavor: "air",notes: "hypothetical",color: "invisible",year: "1",name: "PLANT0"});
CREATE(:TOMATO {flavor: "acidic",notes: "Heirloom seedstock",color: "purple",year: 1890,name: "Cherokee Purple"});
CREATE(:TOMATO {flavor: "sweet",notes: "Heirloom seedstock",color: "bright red",name: "Whittemore"});
CREATE(:TOMATO {flavor: "sweet",notes: "Heirloom seedstock",color: "deep red",year: 1856,name: "Black Krim"});
CREATE(:TOMATO {name: 'Kellogg', color: 'bright red', flavor: 'sweet', year: '1900', notes: 'beautiful and tasty'});
CREATE(:TOMATO {name: 'Brandywine', color: 'bright red', flavor: 'sweet', year: '1900', notes: 'very tasty'});
CREATE(:TOMATO {name: 'Japanese Trifele Black', color: 'dark purple red', flavor: 'sweet', year: '1900', notes: 'nice acidic flavor'});
CREATE(:TOMATO {name: 'Sweet Apertif', color: 'bright red', flavor: 'sweet', year: '1900', notes: 'cherry'});
CREATE(:TOMATO {name: 'Eva Purple', color: 'dark purple red', flavor: 'sweet', year: '1900', notes: 'did not grow well'});
CREATE(:TOMATO {name: 'Mortgage Lifter', color: 'bright red', flavor: 'sweet', year: '1900', notes: 'huge but lacking flavor and lots of bad spots'});
CREATE(:TOMATO {flavor: "sweet",notes: "",color: "deep red",year: "2021",name: "Tomato0000001"});
CREATE(:TOMATO {flavor: "bland",notes: "small tomatoes with little flavor",color: "red",year: "2021",name: "Tomato0000002"});
CREATE(:TOMATO {flavor: "watery",notes: "not much acid",color: "pinkish",year: "2022",name: "Tomato0000003"});
CREATE(:TOMATO {flavor: "sweet",notes: "sweet, slightly acidic",color: "red",year: "2022",name: "Tomato0000004"}) ;
CREATE (:TOMATO {name: 'Tomato0000005', color: 'bright red', flavor: 'sweet', year: '2022', notes: 'amazing'});
CREATE (:TOMATO {name: 'Tomato0000006', color: 'bright red', flavor: 'sweet', year: '2023', notes: 'beautiful and tasty but no bigger than parent'});
CREATE (:TOMATO {name: 'Tomato0000007', color: 'bright red', flavor: 'sweet', year: '2023', notes: 'beautiful and tasty but no bigger than parent'});
CREATE (:TOMATO {name: 'Tomato0000008', color: 'bright red', flavor: 'sweet', year: '2023', notes: 'beautiful and tasty, slightly larger than parent'});
Show records with MATCH
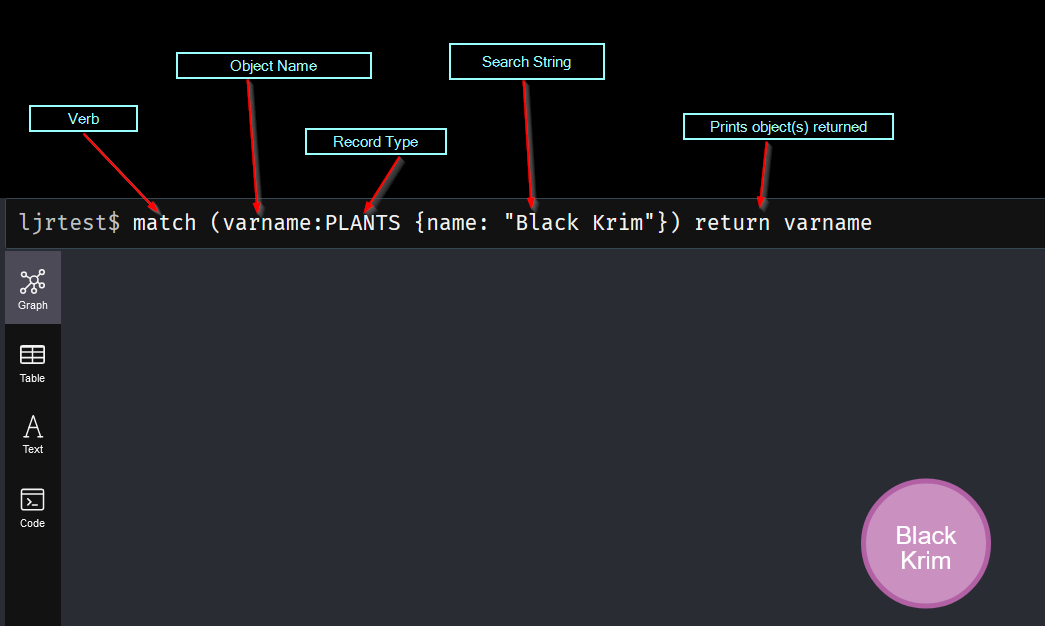
The search starts with the verb “MATCH”. In parenthesis, we add the matching rule. This begins with an object name variable – you can have anonymous nodes (no variable names assigned) by omitting this string and just typing the colon. This is followed by the label that we want to match – basically the type of node we are looking for. Then, in curly braces, a filter – in this case, I am looking for nodes where the “name” field has the value “Black Krim”. Finally, there’s a return statement that indicates that we want to output the matched results.
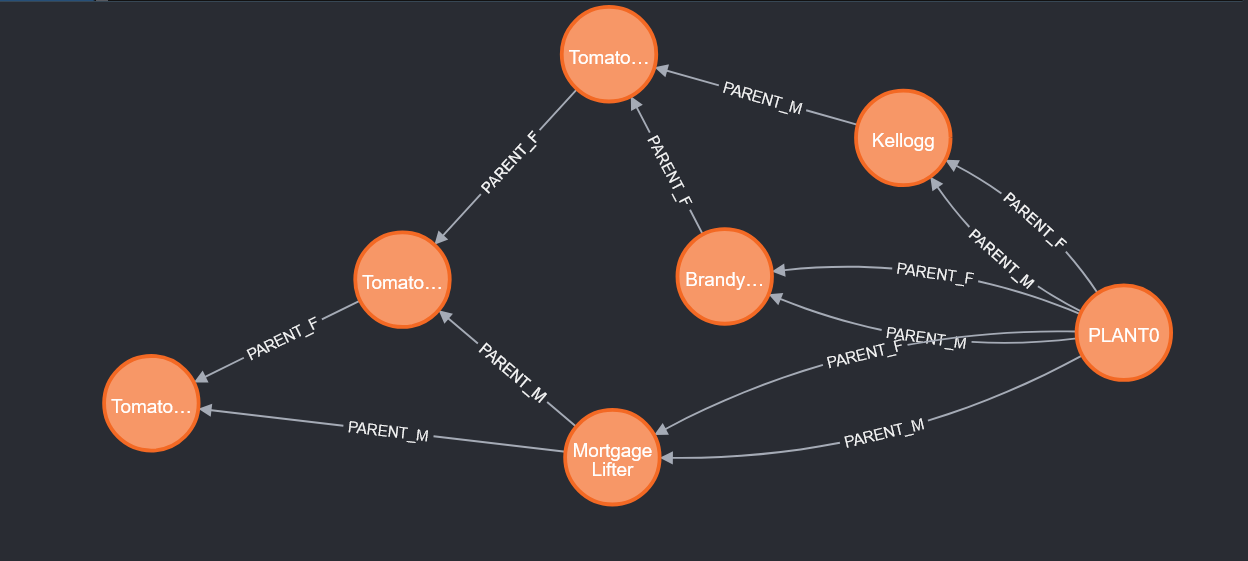
You can include relationships in the query – parenthesis around nodes and square brackets around relationships.
(placeholdername:nodes)-[:RELATIONSHIP_CONNECTION_TYPE]->(anotherplaceholdername:otherNodes)
This is what makes graph databases interesting for tracking hybridization – we can easily produce the lineage of the plants we develop.
Deleting a record
Deleting a record is used in conjunction with match — use the DELETE verb on the collections of objects returned into your variable name. Here, the variable is ‘x’:
MATCH (x:PLANTS{name: 'Black Krim'})
DELETE x
Deleting a record and relationships by ID
When deleting a record, you can include relationship matches:
MATCH (p:PLANTS) where ID(p)=1
OPTIONAL MATCH (p)-[r]-()
DELETE r,p
Create a relationship
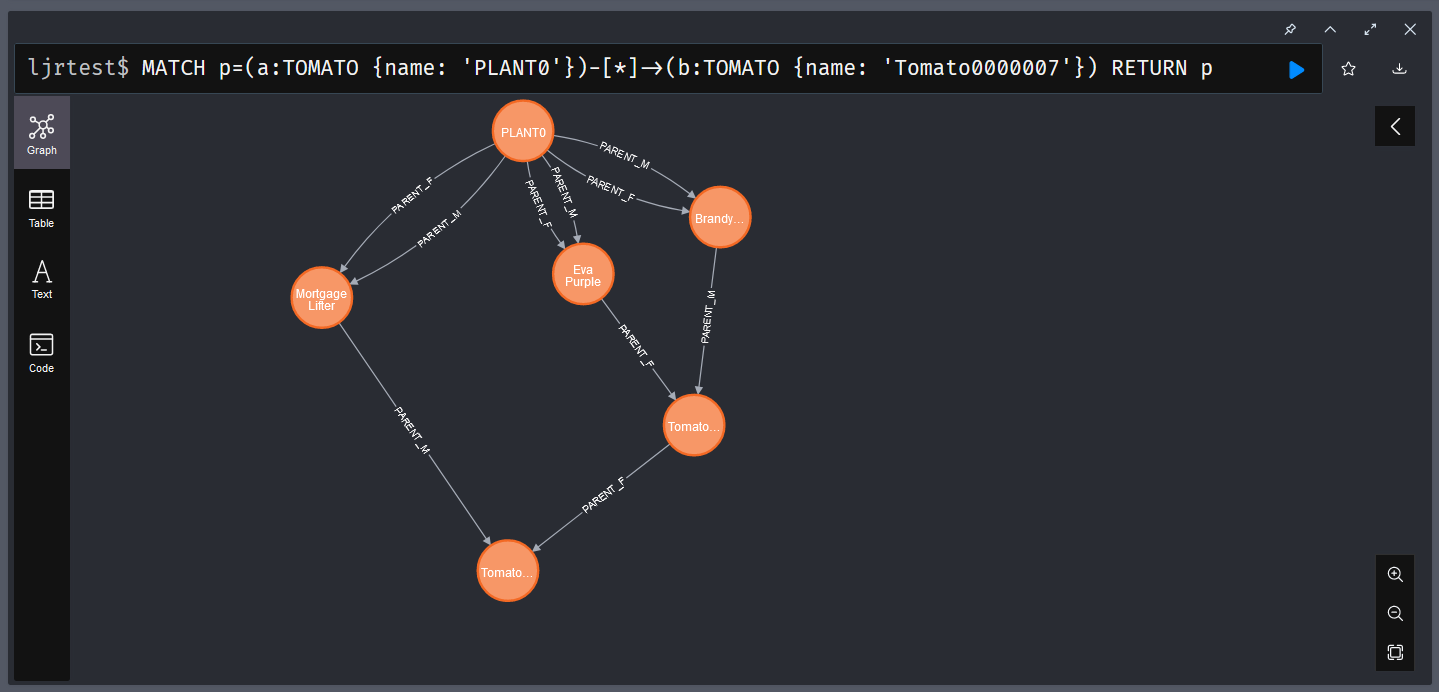
To create a relationship, we first need to match two objects – here I am finding a plant named PLANT0 and all of the “heirloom seedstock” plants to which I assigned year 1900 – and create parent/child relationships. Since there is both a male and female parent, that is included in the relationship name:
MATCH (a:TOMATO), (b:TOMATO)
WHERE a.name = 'PLANT0' AND b.year = '1900'
CREATE (a)-[r:PARENT_M]->(b)

MATCH (a:TOMATO), (b:TOMATO)
WHERE a.name = 'PLANT0' AND b.year = '1900'
CREATE (a)-[r:PARENT_F]->(b)
Create records with parent/child relationships
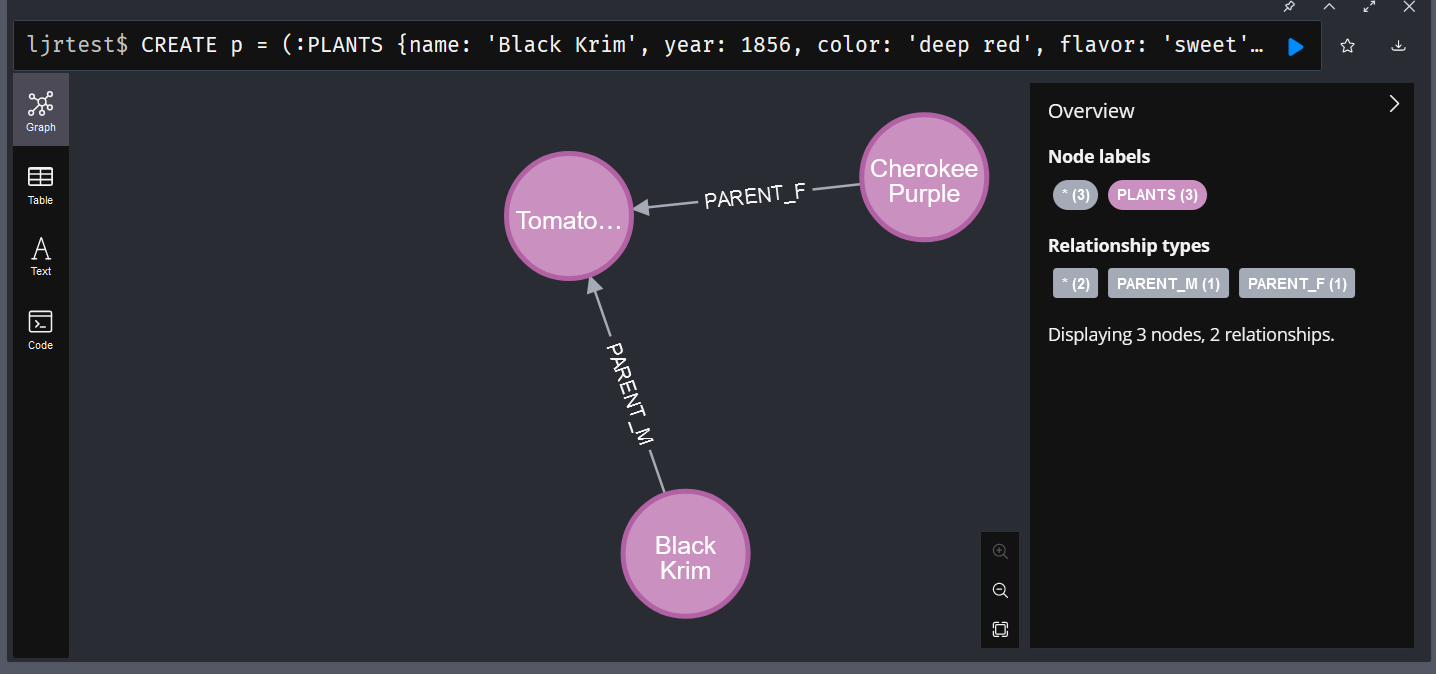
You can create records and relationships in a single command, too:
CREATE p = (:PLANTS {name: 'Black Krim', year: 1856, color: 'deep red', flavor: 'sweet', notes: 'Heirloom seedstock'})-[:PARENT_M]->(:PLANTS {name: 'Tomato0000001', color: 'deep red', flavor: 'sweet', year: '2023', notes: ''})<-[:PARENT_F]-(:PLANTS {name: 'Cherokee Purple', color: 'purple', flavor: 'acidic', year: 1890, notes: 'Heirloom seedstock'})

RETURN p
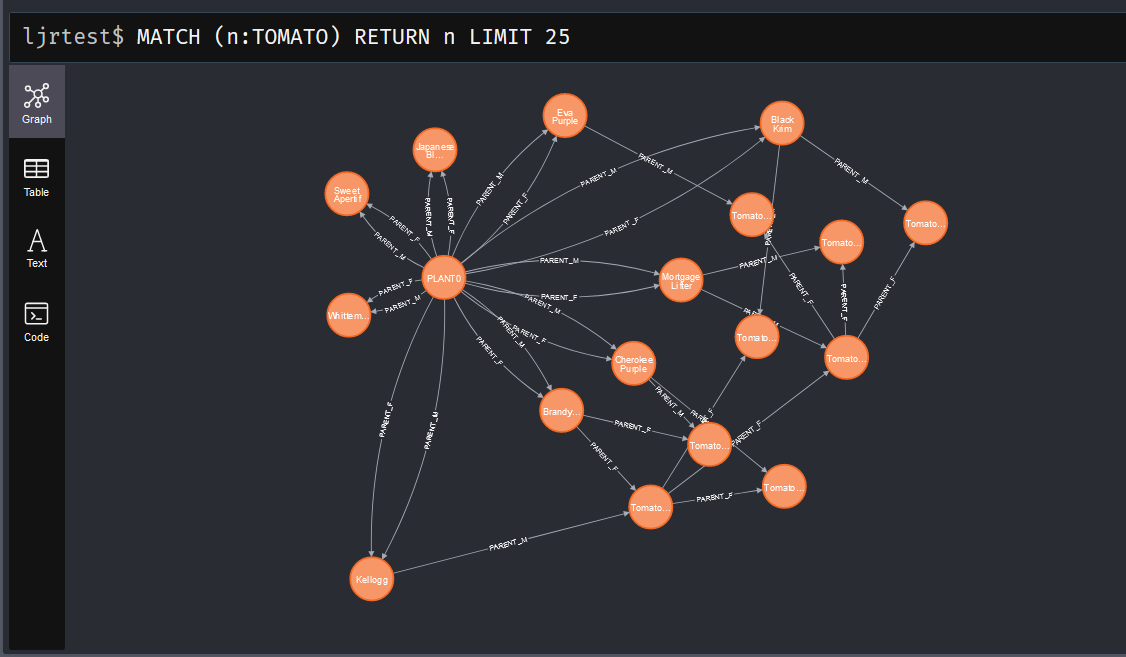
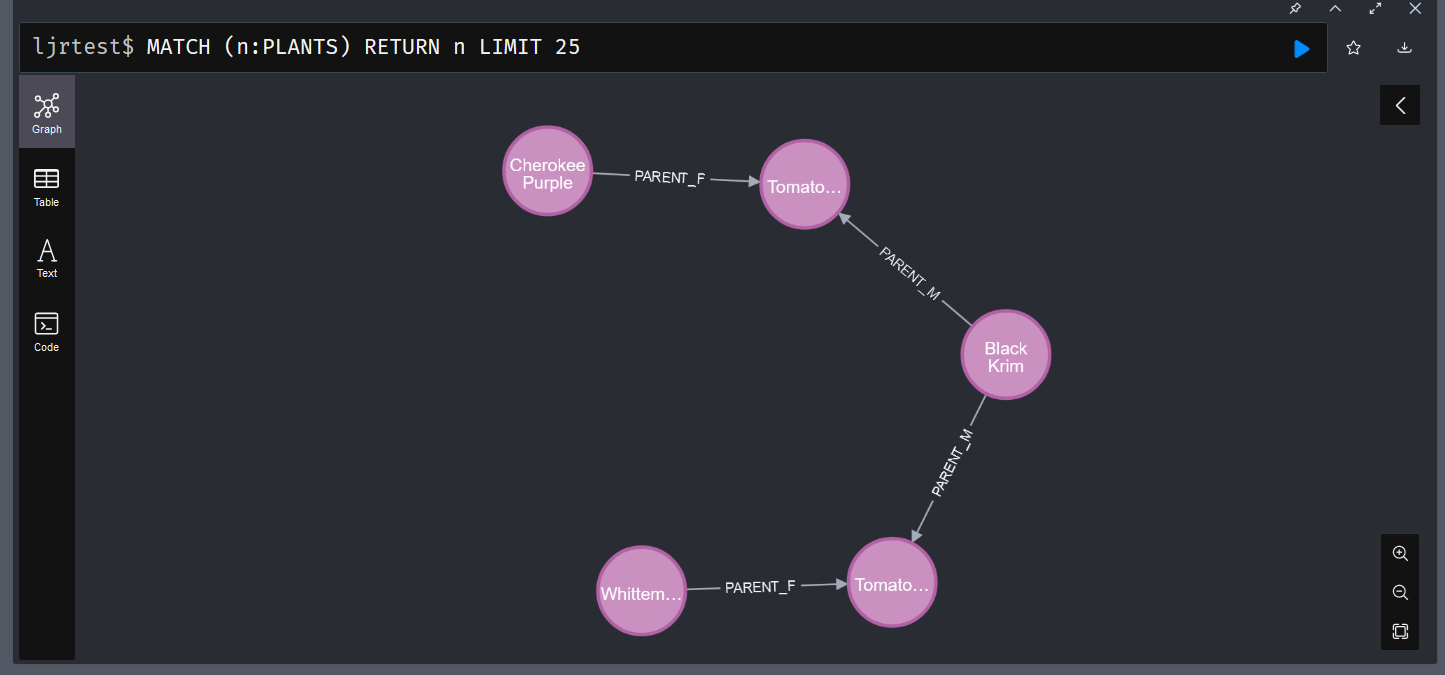
Viewing Records with Relationships
When you match records, you will also get their relationships:
Bulk importing data
LOAD CSV WITH HEADERS FROM ‘https://www.rushworth.us/lisa/ljr_plant_history.csv’