Quick command to list each running VM and the vnet that is associated to the VM
for vm in $(virsh list | grep running | awk '{print $2}'); do echo -n "$vm:"; virsh dumpxml $vm| grep -oP "vnet\d+" ; done
Quick command to list each running VM and the vnet that is associated to the VM
for vm in $(virsh list | grep running | awk '{print $2}'); do echo -n "$vm:"; virsh dumpxml $vm| grep -oP "vnet\d+" ; done
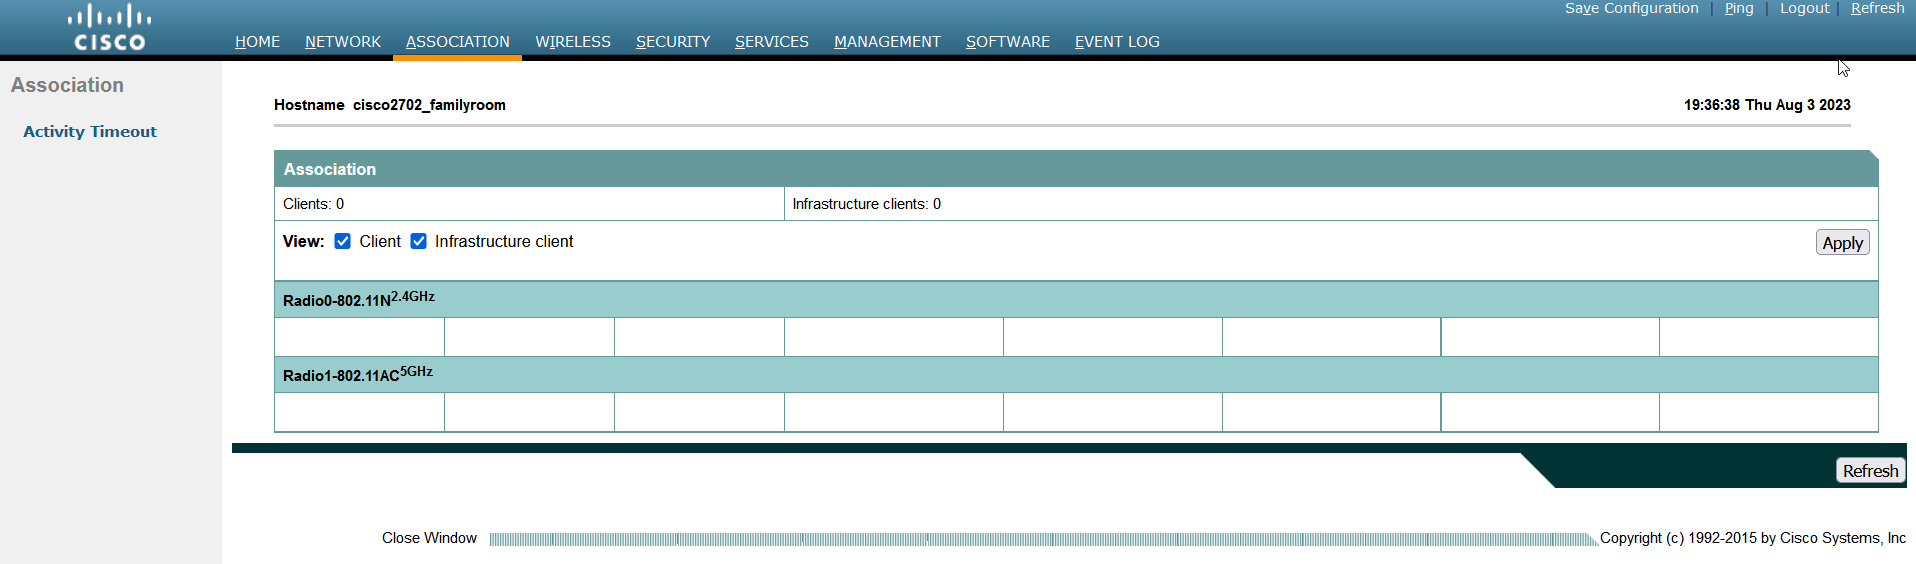
I think this is a fairly esoteric issue — something that happens frequently enough but doesn’t actually impact functionality so anyone notices. We got a new WiFi doorbell that we set up inside (and could access it), took outside (and could access it) … but, when we went back inside? We could not access the doorbell. No HTTPS, no RTSP, no ICMP. Nothing.
Cisco access points maintain a list of associated wireless clients. These may also be kept in an arp table, although arp caching appears to be disabled by default. So device was on AP1, moved to AP2. Clients on AP2 (or AP3, or AP4) were able to access it since the switch has it registered on the port for AP2. Anything on AP1, however, cannot access the device. The MAC address still appeared in the associations table for AP1. You can set a lower activity timeout — the default was one day — to clear devices out more promptly. But … if the device communicates outside of its new WAP, how frequently is it going to be talking to a device on its old WAP? Generally, we’re talking to our servers (wired) or the Internet (also wired). So technically … Scott’s cell phone couldn’t reach my cell phone when I go from the bedroom to the office. But we never notice because we have minimal peer to peer communication. It’s not like doorbells are going to go walking about normally … but it was good to know a quick AP reboot would allow our cell phones to pull up the doorbell’s video feed.
Quick command to report on the IP addresses of all containers running on a Docker server:
docker ps | awk 'NR>1{ print $1 }' | xargs docker inspect -f '{{range .NetworkSettings.Networks}}{{$.Name}}{{" "}}{{.IPAddress}}{{end}}'

We’ve been seeing an error that prevents clients from connecting to Postgresql servers – basically that all available connections are in use and the remaining connections are reserved for superuser and replication activity.
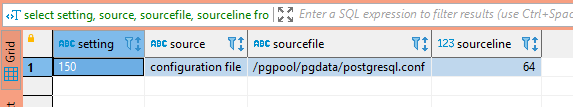
First, we need to determine what the connection limit is —
SELECT setting, source, sourcefile, sourceline FROM pg_settings WHERE name = 'max_connections';
And if there are any per-user connection limits – a limit of -1 means unlimited connections are allowed.
SELECT rolname, rolconnlimit FROM pg_roles
The next step is to identify what connections are exhausting available connections – are there a lot of long-running queries? Are there just more active queries than anticipated? Are there a bunch of idle connections?
SELECT pid, usename, client_addr, client_port
 ,to_char(pg_stat_activity.query_start, 'YYYY-MM-DD HH:MI:SS') as query_start
 , state, query
FROM pg_stat_activity
-- where state = 'idle'
-- and usename = 'app_user'
order by query_start;
In our case, there were over 100 idle connections using up about 77% of the available connections. Auto-vacuum, client read operations, and replication easily filled up the remaining available connections.
Because the clients keeping these idle connections open are an app running in a Kubernetes cluster, there’s an extra layer of complexity identifying where the connection is actually sourced. When you view the list of connections from the Postgresql server’s perspective, “client_addr” is the worker hosting the pod.
On the worker server, use conntrack to identify the actual source of the connection – the IP address in “-d” is the IP address of the Postgresql server. To isolate a specific connection, select a “client_port” from the list of connections (37900 in this case) and grep for the port. You will see the src IP of the individual POD.
lhost1750:~ # conntrack -L -f ipv4 -d 10.24.29.140 -o extended | grep 37900
ipv4 2 tcp 6 86394 ESTABLISHED src=10.244.4.80 dst=10.24.29.140 sport=37900 dport=5432 src=10.24.29.140 dst=10.24.29.155 sport=5432 dport=37900 [ASSURED] mark=0 use=1
conntrack v1.4.4 (conntrack-tools): 27 flow entries have been shown.
Then use kubeadm to identify which pod is assigned that address:
lhost1745:~ # kubectl get po --all-namespaces -o wide | grep "10.244.4.80"
kstreams kafka-stream-app-deployment-1336-d8f7d7456-2n24x 2/2 Running 0 10d 10.244.4.80 lhost0.example.net <none> <none>
In this case, we’ve got an application automatically scaling up that can have 25 connections help open and idle … so there isn’t really a solution other than increasing the number of available connections to a number that’s appropriate given the number of client connections we plan on leaving open. I also want to enact a connection limit on the individual account – if there are 250 connections available on the Postgresql server, then limit the application to 200 of those connections.
We’ve had a number of very strange network problems lately — Zoneminder cannot talk to cameras, clients veg out talking to Myth, Twonky is non-functional (even the web page — you get enough of the header to have a title, but the page just hangs, Scott cannot get to our Discourse site. And, more frustratingly, he cannot SSH to some of our hosts. Using “ssh -v” and throwing on a bunch of flags to not attempt key auth (-o PasswordAuthentication=yes -o PreferredAuthentications=keyboard-interactive,password -o PubkeyAuthentication=no) and his connection still hung. But, at least, I could see something. The last thing the SSH connection reported is:
debug1: expecting SSH2_MSG_KEX_ECDH_REPLY
Which I’ve seen before … fortunately when I had a great Unix support guy working in the same office building that I did. Who let me stop over and bounce really oddball problems off of him. He told me to enable mtu probing.
echo 1 >/proc/sys/net/ipv4/tcp_mtu_probing
And, if that doesn’t work, use “echo 2”. Which …. yeah, wouldn’t have been any of my first thirty guesses. Cloudflare published a good article on what exactly MTU path discovery is, and I can RTFM enough to figure out what I’ve set here. But no idea what’s got a smaller MTU than our computers.
tcp_mtu_probing - INTEGER
	Controls TCP Packetization-Layer Path MTU Discovery.
	  0 - Disabled
	  1 - Disabled by default, enabled when an ICMP black hole detected
2 - Always enabled, use initial MSS of tcp_base_mss.Every once in a while, my Windows server says it has no Internet connection. It does. It can even use the connection. But the little systray icon has a yellow glif and it says there’s no connection. It’s cosmetic, but annoying. I’ve discovered, however, that there’s a “Network Location Awareness” service that can be restarted to re-evaluate the connectivity status.

We’ve been seeing dropped packets on one of our servers — that usually means more data is coming in than can be processed, but it’s nice to confirm rather than guess. The command “netstat -s” displays summary statistics that are nicely grouped into causes:
TcpExt:
16 invalid SYN cookies received
88 resets received for embryonic SYN_RECV sockets
18 packets pruned from receive queue because of socket buffer overrun
2321 ICMP packets dropped because they were out-of-window
838512 TCP sockets finished time wait in fast timer