We’ve been seeing an error that prevents clients from connecting to Postgresql servers – basically that all available connections are in use and the remaining connections are reserved for superuser and replication activity.
First, we need to determine what the connection limit is —
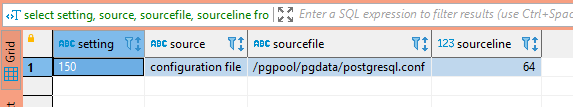
SELECT setting, source, sourcefile, sourceline FROM pg_settings WHERE name = 'max_connections';
And if there are any per-user connection limits – a limit of -1 means unlimited connections are allowed.
SELECT rolname, rolconnlimit FROM pg_roles
The next step is to identify what connections are exhausting available connections – are there a lot of long-running queries? Are there just more active queries than anticipated? Are there a bunch of idle connections?
SELECT pid, usename, client_addr, client_port
 ,to_char(pg_stat_activity.query_start, 'YYYY-MM-DD HH:MI:SS') as query_start
 , state, query
FROM pg_stat_activity
-- where state = 'idle'
-- and usename = 'app_user'
order by query_start;
In our case, there were over 100 idle connections using up about 77% of the available connections. Auto-vacuum, client read operations, and replication easily filled up the remaining available connections.
Because the clients keeping these idle connections open are an app running in a Kubernetes cluster, there’s an extra layer of complexity identifying where the connection is actually sourced. When you view the list of connections from the Postgresql server’s perspective, “client_addr” is the worker hosting the pod.
On the worker server, use conntrack to identify the actual source of the connection – the IP address in “-d” is the IP address of the Postgresql server. To isolate a specific connection, select a “client_port” from the list of connections (37900 in this case) and grep for the port. You will see the src IP of the individual POD.
lhost1750:~ # conntrack -L -f ipv4 -d 10.24.29.140 -o extended | grep 37900
ipv4 2 tcp 6 86394 ESTABLISHED src=10.244.4.80 dst=10.24.29.140 sport=37900 dport=5432 src=10.24.29.140 dst=10.24.29.155 sport=5432 dport=37900 [ASSURED] mark=0 use=1
conntrack v1.4.4 (conntrack-tools): 27 flow entries have been shown.
Then use kubeadm to identify which pod is assigned that address:
lhost1745:~ # kubectl get po --all-namespaces -o wide | grep "10.244.4.80"
kstreams kafka-stream-app-deployment-1336-d8f7d7456-2n24x 2/2 Running 0 10d 10.244.4.80 lhost0.example.net <none> <none>
In this case, we’ve got an application automatically scaling up that can have 25 connections help open and idle … so there isn’t really a solution other than increasing the number of available connections to a number that’s appropriate given the number of client connections we plan on leaving open. I also want to enact a connection limit on the individual account – if there are 250 connections available on the Postgresql server, then limit the application to 200 of those connections.