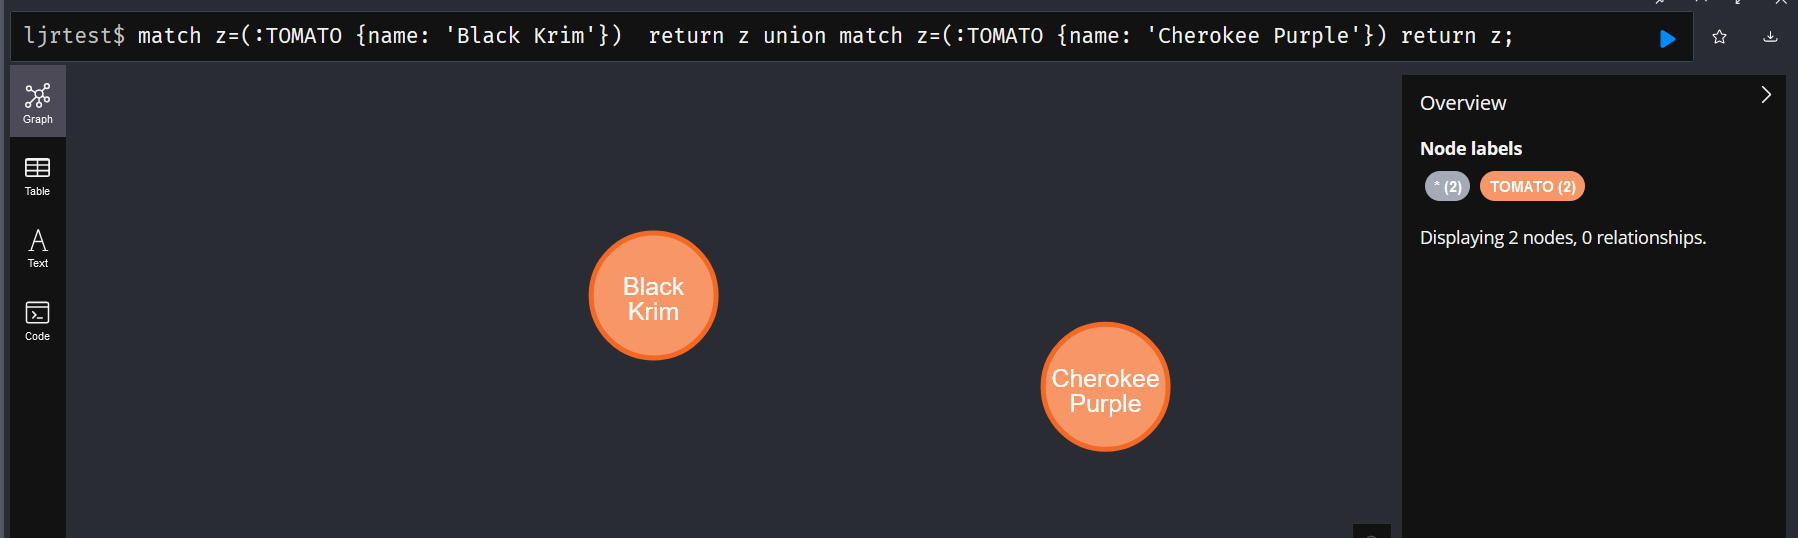
Category: Technology

Finding PCI Devices

You can use dmidecode to list all sorts of information about the system — there is a list of device types that you can use with the “-t” option

   Type   Information
   ────────────────────────────────────────────
      0   BIOS
      1   System
      2   Baseboard
      3   Chassis
      4   Processor
      5   Memory Controller
      6   Memory Module
      7   Cache
      8   Port Connector
      9   System Slots
     10   On Board Devices
     11   OEM Strings
     12   System Configuration Options
     13   BIOS Language
     14   Group Associations
     15   System Event Log
     16   Physical Memory Array
     17   Memory Device
     18   32-bit Memory Error
     19   Memory Array Mapped Address
     20   Memory Device Mapped Address
     21   Built-in Pointing Device
     22   Portable Battery
     23   System Reset
     24   Hardware Security
     25   System Power Controls
     26   Voltage Probe
     27   Cooling Device
     28   Temperature Probe
     29   Electrical Current Probe
     30   Out-of-band Remote Access
     31   Boot Integrity Services
     32   System Boot
     33   64-bit Memory Error
     34   Management Device
     35   Management Device Component
     36   Management Device Threshold Data
     37   Memory Channel
     38   IPMI Device
     39   Power Supply
     40   Additional Information
     41   Onboard Devices Extended Information
     42   Management Controller Host Interface

Blah

[lisa@fedora ~/]# dmidecode -t 9

Handle 0x0024, DMI type 9, 17 bytes
System Slot Information
Designation: Slot6
Type: 32-bit PCI
Current Usage: In Use
Length: Short
ID: 6
Characteristics:
3.3 V is provided
Opening is shared
PME signal is supported
Bus Address: 0000:0a:02.0

The “Bus Address” value corresponds to information from lspci:

[lisa@fedora ~/]# lspci | grep “0a:02.0”
0a:02.0 Multimedia video controller: Conexant Systems, Inc. CX23418 Single-Chip MPEG-2 Encoder with Integrated Analog Video/Broadcast Audio Decoder

OpenID Authentication with OpenDistro

The following configuration changes needed to be made to enable federated authentication through OpenIDC using OpenDistro 1.8.0 withElasticSearch 7.7.0 — this presupposes that you have an application properly registered with an OIDC identity provider.

./kibana/config/kibana.yml

opendistro_security.auth.type: "openid"
opendistro_security.openid.connect_url: "https://login.example.com/.well-known/openid-configuration"
opendistro_security.openid.client_id: "REDACTED"
opendistro_security.openid.client_secret: "REDACTED"
opendistro_security.openid.scope: "openid"
opendistro_security.openid.header: "Authorization"
opendistro_security.openid.base_redirect_url: "https://opensearch.dev.example.com"

And then on the ElasticSearch node, update ./elasticsearch/config/elasticsearch.yml

opendistro_security.ssl.transport.truststore_filepath: cacerts

And ./elasticsearch/plugins/opendistro_security/securityconfig/config.yml

      basic_internal_auth_domain:
        description: "Authenticate via HTTP Basic against internal users database"
        http_enabled: true
        transport_enabled: true
        order: 4
        http_authenticator:
          type: basic
          challenge: true
        authentication_backend:
          type: intern
      openid_auth_domain:
        http_enabled: true
        transport_enabled: true
        order: 1
        http_authenticator:
          type: openid
          challenge: false
          config:
            enable_ssl: true
            verify_hostnames: false
            openid_connect_url: https://login.example.com/.well-known/openid-configuration
        authentication_backend:
          type: noop

Use securityadmin.sh to update — it helps if you update ./elasticsearch/plugins/opendistro_security/securityconfig/roles_mapping.yml

all_access:
  reserved: false
  backend_roles:
  - "admin"
  users:
  - "lisa"
  description: "Maps admin to all_access"

My experience is that the ElasticSearch API will allow authentication for local users. Kibana, however, does not — if you want to allow local users to log into Kibana, you’d either need a different Kibana instance (permanently allow local users to access Kibana) or update the kibana.yml to exclude the federated logon stuff & restart the service (temporary workaround when the identity provider has an issue).

The biggest challenge that I encountered is that there is, evidently, a bug in OpenDistro 1.13.1 that makes OIDC authentication non-functional. Downgrading to OpenDistro 1.13.0 worked, 1.8.0 (the version matched with our ElasticSearch 7.7.0 iteration) worked. And, reportedly, the newest 1.13.3 works as well.

Upgrading Kafka from 2.5.0 to 3.2.3

Bidirectional backwards compatibility was introduced in 2017 – which means my experience where you needed to upgrade the broker first and then the clients is no longer true. Rejoice!

Sandbox Setup

Two CentOS docker containers were provisioned as follows:

docker run -dit --name=kafka1 -p 9092:9092 centos:latest
docker run -dit --name=kafka2 -p 9093:9092 -p9000:9000 centos:latest

# Shell into each container and do the following:

sed -i -e "s|mirrorlist=|#mirrorlist=|g" /etc/yum.repos.d/CentOS-*
sed -i -e "s|#baseurl=http://mirror.centos.org|baseurl=http://vault.centos.org|g" /etc/yum.repos.d/CentOS-*

# Get Ips and hosts into /etc/hosts

172.17.0.2 40c2222cfea0
172.17.0.3 2923addbcb6d

# Update installed packages & install required tools

dnf update
yum install -y passwd vim net-tools wget git unzip
# Add a kafka user, make a kafka folder, and give the kafka user ownership of the kafka folder
useradd kafka
passwd kafka
usermod -aG wheel kafka

mkdir /kafka

chown kafka:kafka /kafka

# Install Kafka

su – kafka
cd /kafka
wget https://archive.apache.org/dist/kafka/2.5.0/kafka_2.12-2.5.0.tgz
tar vxzf kafka_2.12-2.5.0.tgz
rm kafka_2.12-2.5.0.tgz
ln -s /kafka/kafka_2.12-2.5.0 /kafka/kafka

# Configure zookeeper

vi /kafka/kafka/config/zookeeper.properties
dataDir=/kafka/zookeeperdata
server.1=172.17.0.2:2888:3888

# Start Zookeeper on the first server

screen -S zookeeper
/kafka/kafka/bin/zookeeper-server-start.sh /kafka/kafka/config/zookeeper.properties

# Configure the cluster

vi /kafka/kafka/config/server.properties

broker.id=1 # unique number per cluster node
listeners=PLAINTEXT://:9092
zookeeper.connect=172.17.0.2:2181

# Start Kafka

screen -S kafka
/kafka/kafka/bin/kafka-server-start.sh /kafka/kafka/config/server.properties

# Edit producer.properties on a server

vi /kafka/kafka/config/producer.properties
bootstrap.servers=172.17.0.2:9092,172.17.0.3:9092

# Create test topic

/kafka/kafka/bin/kafka-topics.sh --create --zookeeper 172.17.0.2:2181 --replication-factor 2 --partitions 1 --topic ljrTest

# Post messages to the topic

/kafka/kafka/bin/kafka-console-producer.sh --broker-list 172.17.0.2:9092 --producer.config /kafka/kafka/config/producer.properties --topic ljrTest

# Retrieve messages from topic

/kafka/kafka/bin/kafka-console-consumer.sh --bootstrap-server 172.17.0.2:9092 --topic ljrTest --from-beginning
/kafka/kafka/bin/kafka-console-consumer.sh --bootstrap-server 172.17.0.3:9092 --topic ljrTest --from-beginning

Voila, a functional Kafka sandbox cluster.

Now we’ll install the cluster manager

cd /kafka
git clone --depth 1 --branch 3.0.0.6 https://github.com/yahoo/CMAK.git
cd CMAK
vi conf/application.conf
cmak.zkhosts="40c2222cfea0:2181"

# CMAK requires java > 1.8 … so getting 11 set up
cd /usr/lib/jvm
wget https://cdn.azul.com/zulu/bin/zulu11.58.23-ca-jdk11.0.16.1-linux_x64.zip
unzip zulu11.58.23-ca-jdk11.0.16.1-linux_x64.zip
mv zulu11.58.23-ca-jdk11.0.16.1-linux_x64 zulu-11
PATH=/usr/lib/jvm/zulu-11/bin:$PATH

./sbt -java-home /usr/lib/jvm/zulu-11 clean dist

cp /kafka/CMAK/target/universal/cmak-3.0.0.6.zip /kafka

cd /kafka
unzip cmak-3.0.0.6.zip
cd cmak-3.0.0.6
screen -S CMAK
bin/cmak -java-home /usr/lib/jvm/zulu-11 -Dconfig.file=/kafka/cmak-3.0.0.6/conf/application.conf -Dhttp.port=9000

Access it at http://cmak_host:9000

Sandbox Upgrade Process

# Back up the Kafka installation (excluding log files)

tar cvfzp /kafka/kafka-2.5.0.tar.gz --exclude logs /kafka/ws_npm_kafka/kafka_2.12-2.5.0

# Get newest Kafka version installed
# From another host where you can download the file, transfer it to the kafka server

scp kafka_2.12-3.2.3.tgz list@kafka1:/tmp/

# Back on the Kafka server — copy the tgz file into the Kafka directory

mv /tmp/kafka_2.12-3.2.3.tgz /kafka/kafka

# Verify Kafka data is stored outside of the install directory:

[kafka@40c2222cfea0 config]$ grep log.dir server.properties
log.dirs=/tmp/kafka-logs

# Verify zookeeper data is stored outside of the install directory:

[kafka@40c2222cfea0 config]$ grep dataDir zookeeper.properties
dataDir=/kafka/zookeeperdata

# Get the new version of Kafka – start with the zookeeper(s) then do the other nodes

cd /kafka
wget https://downloads.apache.org/kafka/3.2.3/kafka_2.12-3.2.3.tgz
tar vxfz /kafka/kafka_2.12-3.2.3.tgz

# Copy config from old iteration to new

cp /kafka/kafka_2.12-2.5.0/config/* /kafka/kafka_2.12-3.2.3/config/

# Edit server.properties and add a configuration line to force the inter-broker protocol version to the currently running Kafka version
# This ensures your cluster is using the “old” version to communicate and you can, if needed, revert to the previous version

vi /kafka/kafka/config/server.properties
inter.broker.protocol.version=2.5.0

# Restart each Kafka server – waiting until it has come online before restarting the next one – with the new binaries
# Stop kafka

systemctl stop kafka

# Move symlink to new folder

unlink /kafka/kafka
ln -s /kafka/kafka_2.12-3.2.3 /kafka/kafka

# start kafka

systemctl start kafka

# Or, to watch it run,

/kafka/kafka/bin/kafka-server-start.sh /kafka/kafka/config/server.properties

# Finally, ensure you’ve still got ‘stuff’

/kafka/kafka/bin/kafka-console-consumer.sh --bootstrap-server 172.17.0.3:9092 --topic ljrTest --from-beginning

# And verify the version has updated

[kafka@40c2222cfea0 bin]$ ./kafka-topics.sh --version
3.2.3 (Commit:50029d3ed8ba576f)

# Until this point, we can just roll back to the old folder & revert to the previous version of Kafka … that’s out backout plan.

# Once everything has been confirmed to be working, bump the inter-broker protocol version to the new version & restart Kafka

vi /kafka/kafka/config/server.properties
inter.broker.protocol.version=3.2

OpenSearch Evaluation Overview

What is ElasticSearch?

ElasticSearch, based on the Lucene search software, is a distributed search and analytics application which ingests, stores, and indexes data. Kibana is a web-based front-end providing user access to data stored within ElasticSearch.

What is OpenSearch?

In short, it’s the same but different. OpenSearch is also based on the Lucene search software, is designed to be a distributed search and analytics application, and ingests/stores/indexes data. If it’s essentially the same thing, why does OpenSearch exist? ElasticSearch was initially licensed under the open-source Apache 2.0 license – a rather permissive free software license. ElasticCo did not agree with how their software was being used by Amazon; and, in 2021, the license for ElasticSearch was changed to Server Side Public License (SSPL). One of the requirements of SSPL is that anyone who implements the software and sells their implementation as a service needs to publish their source code under the SSPL license – not just changes made to the original program but all other software a user would require to run the software-as-a-service environment for themselves. Amazon used ElasticSearch for their Amazon Elasticsearch Service offering, but was unable/unwilling to continue doing so under the new license terms. In April of 2021, Amazon Web Services created a fork of ElasticSearch as the basis for OpenSearch.

Differences Between OpenSearch and ElasticSearch

After the OpenSearch fork was created, the product roadmap for ElasticSearch was driven by ElasticCo and the roadmap for OpenSearch was community driven (with significant oversight and input from Amazon) – this means the products are not identical although they provide the same core functionality. Elastic publishes a list of features unique to ElasticSearch, and the underlying machine learning algorithms are different. However, the important components of the “unique” feature list have been implemented in OpenSearch over time.

The biggest differences are price and support. OpenSearch is free software – there is no purchasing a license to unlock features. It does appear that Amazon has an internal iteration of OpenSearch as their as-a-service offering provides features not available in the open-source OpenSearch code base, but that is only available for cloud customers. ElasticCo offers ElasticSearch as free software with a limited feature set. One critical limitation is user authentication mechanisms – we are unable to implement PingID as an authentication source with the free feature set. Advanced features not currently used today – machine learning based anomaly detection, as an example – are also unavailable in the free iteration of ElasticSearch. With an ElasticSearch license, we would also get vendor support. OpenSearch does not offer vendor support, although there are third party companies that will provide support services.

Both OpenSearch and ElasticSearch have community-based support forums available – I have gotten responses from developers on both forums for questions regarding usage nuances.

Salient Feature Comparison

Most companies have a list differentiating their product from the products offered by competitors – but the important thing is how the products differ as it relates to how an individual customer uses the product. A car that can have a fresh cup of espresso waiting for you as you leave for work might be amazing to some people, but those who don’t drink coffee won’t be nearly as impressed. So how do the two products compare for me?

Data ingestion – Data is ingested using the same mechanisms – ElasticCo’s filebeat and logstash are important components of data ingestion, and these components remain unchanged. This means existing processes that feed data into ElasticSearch today would not need to be changed to begin ingesting data into OpenSearch.

Data storage – Both products distribute searchable data over a cluster of servers. Data storage is “tiered” as hot, warm, and cold which allows less used data to reside on slower, less expensive resources. We have confirmed that ingested data is properly housed on cluster nodes designated for ‘hot’ storage and moved to ‘warm’ and ‘cold’ storage as dictated by defined policies. The item count to size ratio is similar between both products (i.e. storing ten million documents takes about the same amount of disk space). OpenSearch provides the ability to alert on transition failures (moving from hot to warm, for instance) which will reduce the amount of manual “health checking” required for the environment.

Search and aggregation – Both products allow both GUI and API searches of indexed data. Data can be aggregated as it is searched – returning the max/min/average value from a search, a count of records matching search criterion, creating sub-aggregations. ElasticSearch does have aggregations not available in OpenSearch, although these could be handled through custom scripted aggregations and many have corresponding GitHub issues requesting such an aggregation be added to OpenSearch (e.g. weighted average, geohash grid, or geotile grid)

Aggregation Name ElasticSearch 8.x OpenSearch 2.x
auto-interval date histogram x
categorize text x
children x
composite x
frequent items x
geohex grid x
geotile grid x
ip prefix x
multi terms x
parent x
random sampler x
rare terms x
terms x
variable width histogram x
boxplot x
geo-centroid x
geo-line x
median absolute deviation x
rate x
string stats x
t-test x
top metrics x
weighted avg x

Alerting – ElastAlert2 can be used to provide the same index monitoring and alerting functionality that ElastAlert currently provides with ElasticSearch. Additionally, OpenSearch includes a built-in alerting capability that might allow us to streamline the functionality into the base OpenSearch implementation.

API Access – Both ElasticSearch and OpenSearch provide API-based access to data. Queries to the ElasticSearch API endpoint returned expected data when directed to the OpenSearch API endpoint. The ElasticSearch python module can be used to access OpenSearch data, although there is a specific OpenSearch module as well.

UX – ElasticSearch allows users to search and visualize data through Kibana; OpenSearch provides graphical user access in OpenSearch Dashboard. While the “look and feel” of the GUI differs (Kibana 8 looks different than the Kibana 7 we use today, too), the user functionality remains the same.

Kibana 7.7 OpenSearch Dashboards 2.2

Kibana uses “KQL” – Kibana Query Language – to compose searches while OpenSearch Dashboards uses “DQL” – Dashboards Query Language, but queries used in Kibana were used in OpenSearch Dashboard without modification.

Currently used visualizations are available in both Kibana and OpenSearch Dashboards

Kibana Visualization OpenSearch Dashboards Visualization

But there are some currently unused visualizations that are unique to each product.

Visualization Kibana OpenSearch Dashboard
Area x x
Controls x x
Coordinate Map x
Data Table x x
Gantt Chart x
Gauge x x
Goal x x
Heat Map x x
Horizonal Bar x x
Lens x
Line x x
Maps x
Markdown x x
Metric x x
Pie x x
Region Map x
Tag Cloud x x
Timeline x x
TSVB x x
Vega x x
Vertical Bar x x

Dashboards can be used to group visualizations.

Kibana OpenSearch Dashboards

New features will be available in either OpenSearch or a licensed installation of ElasticSearch. Currently data is either retained as written or aged out of the system to save disk space. Either path allows us to roll up data – as an example retaining the total number of users per month or total bytes per month instead of retaining each detailed record. Additionally, we will be able to use the “anomaly detection” which is able to monitor large volumes of index data and highlight unusual events. Both newer ElasticSearch versions and OpenSearch offer a Tableau connector which may make data stored in the platform more accessible to users.


ElasticSearch – Listing Snapshots in AWS S3

To view the snapshots held in AWS, you should be able to use Kibana. From “Management” navigate to “Snapshot and Restore” and look at the list of snapshots. We, however, get a timeout attempting to view the snapshots. Instead, use the _snapshot ES API endpoint to get the name of the repository:

Then use the name to create the ES API URI to get a list of snapshots in the repository – GET _snapshot/*?verbose=false – you will get a list of snapshots, which indices are included in each snapshot, and a state (SUCCESS or FAILED).

Building Vouch Oauth Proxy

I am using an NGINX container which is based on Debian 11 — following the vouch-proxy build instructions failed spectacularly on the first step, reporting that “package embed is not in GOROOT”. It appears that Debian package installation gets you go 1.15 — and ’embed’ wasn’t added until 1.16. So … that’s not great.

As a note to myself — here are the additional packages I install to the base container:

apt-get update
apt-get upgrade
apt-get install vim wget net-tools procps git make gcc g++

To manually install golang on Debian:

  • Find the version you want to run on https://golang.org/dl/ and wget that tar.gz file
    • wget https://go.dev/dl/go1.19.linux-amd64.tar.gz
  • tar -vxf go1.19.linux-amd64.tar.gz
  • mv go /usr/local/
  • vi /etc/bash.bashrc and append the following lines:
    export GOROOT=/usr/local/go
    export PATH=$GOROOT/bin:$PATH
  • Log out and log back in. Test the go installation by running:
    • go version

Now I am able to run their shell script to build the vouch-proxy binary:

  • cd /opt
  • git clone https://github.com/vouch/vouch-proxy.git
  • cd vouch-proxy
  • ./do.sh goget
  • ./do.sh build
  • cd configure
  • cp config.yml_example_oidc config.yml
  • ./vouch-proxy


XRDP Logon Hangs on Black Screen

I’m writing it down this time — after completing the steps to set up xrdp (installed, configured, running, firewall port open), we get prompted for credentials … good so far!

And then get stuck on a black screen. This is because the user we’re trying to log into is already logged into the machine. Log out locally, and the user is able to log into the remote desktop connection. Conversely, attempting to log in locally once the remote desktop connection is established just hangs on a black screen too.

Cisco – Converting Access Point from Lightweight to Autonomous Firmware

I’ve seen a number of walkthroughs detailing how to convert an Aironet Wireless Access Point that’s using the lightweight firmware (the firmware which relies on something like a CAPWAP server to provide configuration so there’s not much in the way of local config options) to the autonomous firmware (one with local config & a management GUI). A few people encounter issues because downloading firmware requires a TACACS agreement — great if you’re a network engineer at a company, not great if you’ve bought a single access point somewhere.

While “google it and find someone who has posted the file … then verify the MD5 sum checks out” is an answer, a lot of the newer firmwares appear to have a major bug where any attempt to commit changes yields a 404 error. ap3g2-k9w7-tar.153-3.JF12.tar, ap3g2-k9w7-tar.153-3.JF15.tar, ap3g2-k9w7-tar.153-3.JPI4.tar — all very buggy.  While it may be possible to use the CLI to “copy ru star” and write the running config into the startup config … that’s going to be difficult to explain to someone else. Something else odd — the built-in Cisco account is a ‘read only’ user — this may be normal where the GUI shows it as read only but it’s actually got management permission?

What I’ve realized, in our attempt to convert into a fully functional autonomous firmware, is that the specific version referenced in one of the walkthroughs (ap3g2-k9w7-tar.153-3.JH.tar) is a deliberate selection — it’s a security update firmware release. Which means it’s available for download for anyone with a Cisco account that’s OK for encryption download (i.e. not residing in one of those countries to which American companies are not allowed to ‘export’ good encryption stuff) even if you don’t have a TACACS account.

Luckily, the JH iteration of the firmware doesn’t have the 404 error on committing changes. The Cisco account is still showing up as read-only, but we were able to make our own read-write user & implement changes.

On Federated Identity Providers

The basic idea here is that you may want someone to be able to validate your users without actually having access to your passwords or directory data. As a counter-example, a company I work with has their payroll “stuff” outsourced. Doing so required a B2B VPN that allowed the hosting company to access an internal LDAP directory. I set up an access control list for their connection so they could only authenticate users. Someone at the hosting company couldn’t download all of the e-mail addresses or phone numbers. Even so, a sufficiently motivated employee of the third-party company could get the logon and password for anyone who used their server – if it’s my code, adding the equivalent of ‘fileHandle.write(f”u:{username} p:{password}”)’ would write a log file with every cred used on the site.

Don’t contract with dodgy companies that are going to drop your user creds out to a file and do malicious stuff is a good start, but I would concede that “avoid dodgy companies” isn’t a great security paradigm.  Someone came up with this “federated identity” methodology — instead of you asking the user for their ID and password, you get a URL to redirect not-yet-logged-on users over to someone trusted to handle passwords. This is the “identify provider”, or IDP.

I access your website (called the ‘service provider’, or SP), and you see I don’t have any sort of auth cookie to get me logged in. You forward my browser, along with some header info, over to IdentityProviderSite. IdentityProviderSite says to the end user “hey, what is your username and password”, checks that what is entered, maybe does the MFA “really, prove it” thing, and then redirects the browser back to the originating website. It includes some header stuff that says “Hi, I am IdentityProviderSite and I used my trusted private key to sign this message. I promise that the person associated with this connection is really Lisa. And here’s her important info (could just be username, could be first name, last name, email address, etc) that you can also trust is right.” No idea why, but the info about the person is called an “assertion” — so you’ll see talk about mapping assertions (which is basically telling my application that the thing it calls “logonID” is going to be called “userID” or “uid” or whatever in the data coming from IdentityProviderSite). Voila, I’m now on your website and logged in even though my password never transited your system. All you ever got was a promise that the person on this connection is really Lisa.

To accomplish this, there is a ‘trust’ between an application & an identity provider — if you tried to send a web user to IdentityProviderSite without establishing such a trust, it would say “yeah, I’m not validating users for you — I have no idea who you are”. And, similarly, a web app isn’t going to just trust any random source to say “really, I promise this is Lisa”. So we go into the web application and say “I really, really want to trust IdentityProviderSite when it tells me a user’s ID” and then go into IdentityProviderSite and say “I want WebApp to be able to ask to validate users”. And there’s some crypto stuff because IdentityProviderSite signs it’s “I promise this is Lisa” message & we don’t want someone to be able to edit that to say “I promise this is Fred”.

Why, oh why, is “where to send the authenticated person back to continue on their merry way” called an Assertion Consumer Service? The “service provider” is supposed to “consume” the identity … so it’s the URL of the “assertion consumer” (i.e. the code in the application that has some clue what to do with the “I promise this is Lisa” blob of data that they call an assertion).

Does this make any sense for third-party companies that we really shouldn’t trust? Companies that aren’t located on our internal network to access our directories directly? Absolutely! Does this make any sense for our internal stuff? Stuff with direct, encrypted access to the AD directory? Eh … it goes well with the “trust no one” security principal. And points for consistency — every app’s logon will look the same. But it’s a lot of overhead / Internet traffic / complexity, too.

The basic process flow when a user attempts to use a site is:

  1. A client attempts to access some web resource to which they are not already authenticated
  2. The end web application redirects the client to the Identity Provider.
  3. The Identity Provider authenticates the user.
  4. The Identity Provider redirects the client to the Assertion Consumer Service (ACS) on the web resource by sending a SAML response over HTTP POST.
  5. The web server processes the SAML response.
  6. The client is redirected to the actual web application URL
  7. The web server authorizes the user to access the requested web resource.
  8. The application server sends the HTTP response back to client.