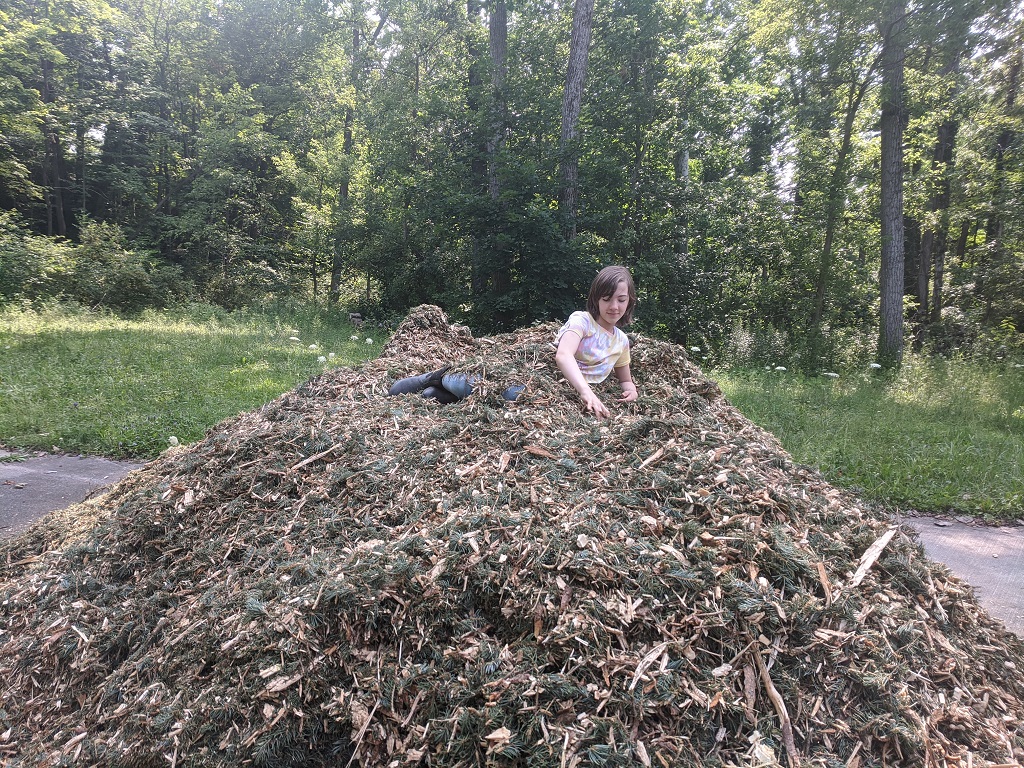
We got a whole truckload of mulch from a local arborist — a lot of pine, so it smells really good.
We got a whole truckload of mulch from a local arborist — a lot of pine, so it smells really good.
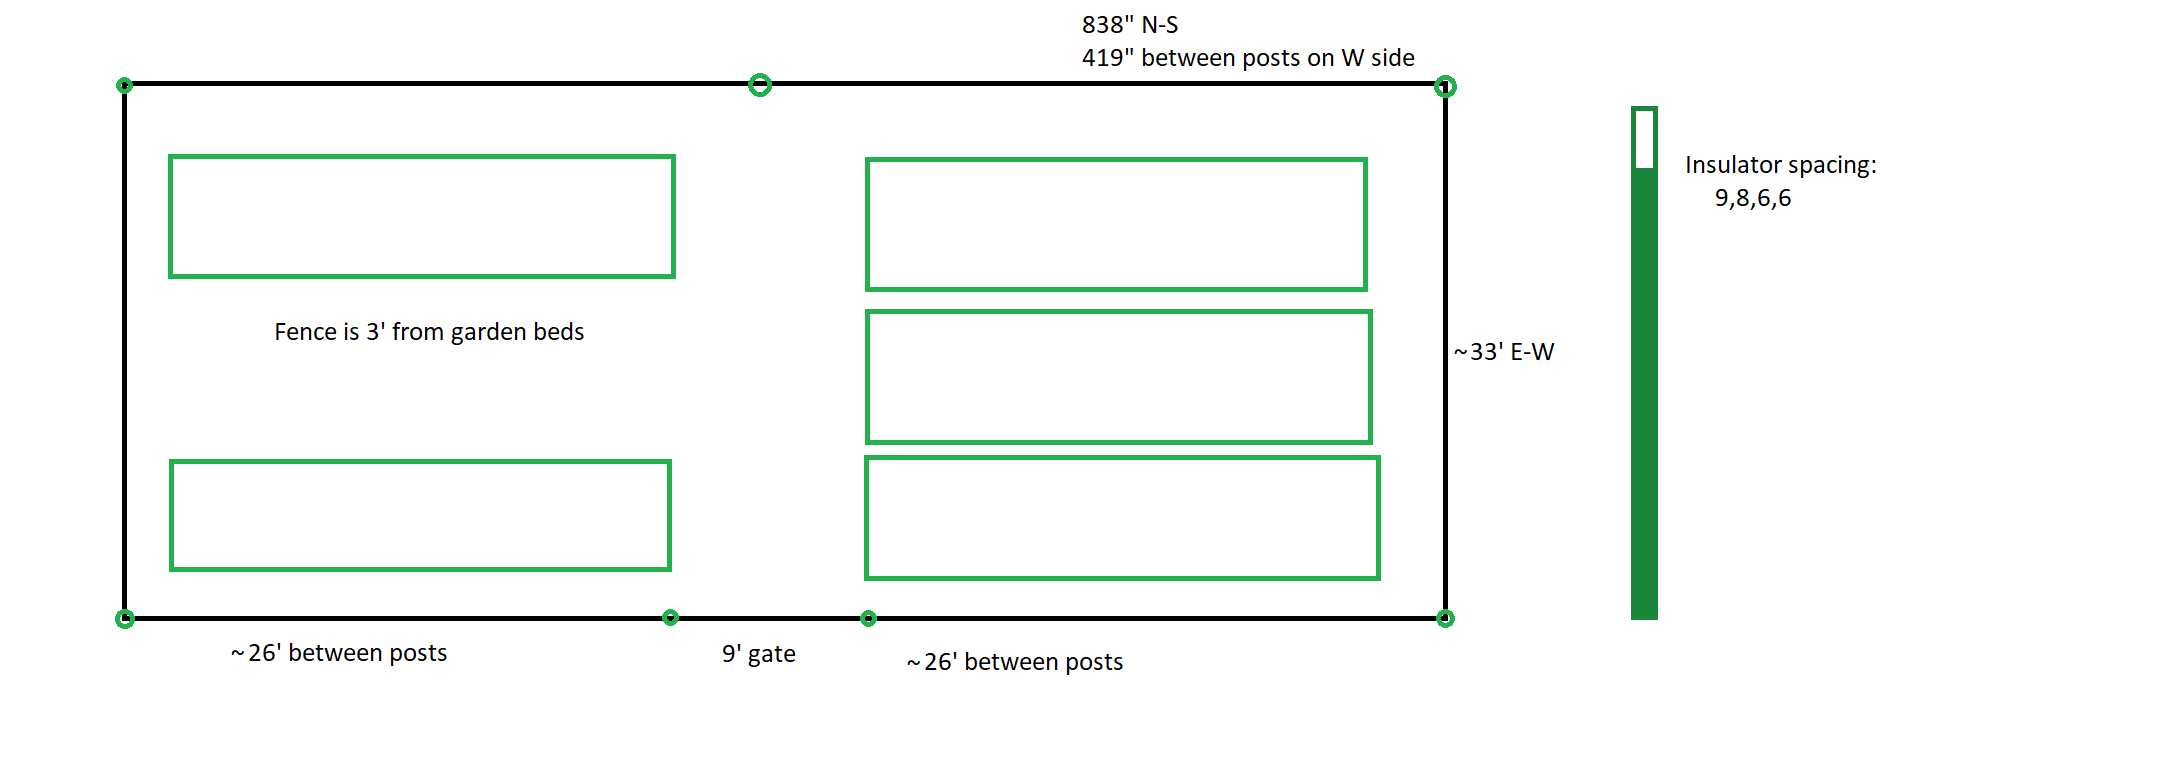
And today we added the electric fence around the garlic — it’s almost time to harvest the garlic and get our broccoli and cabbages into the bed
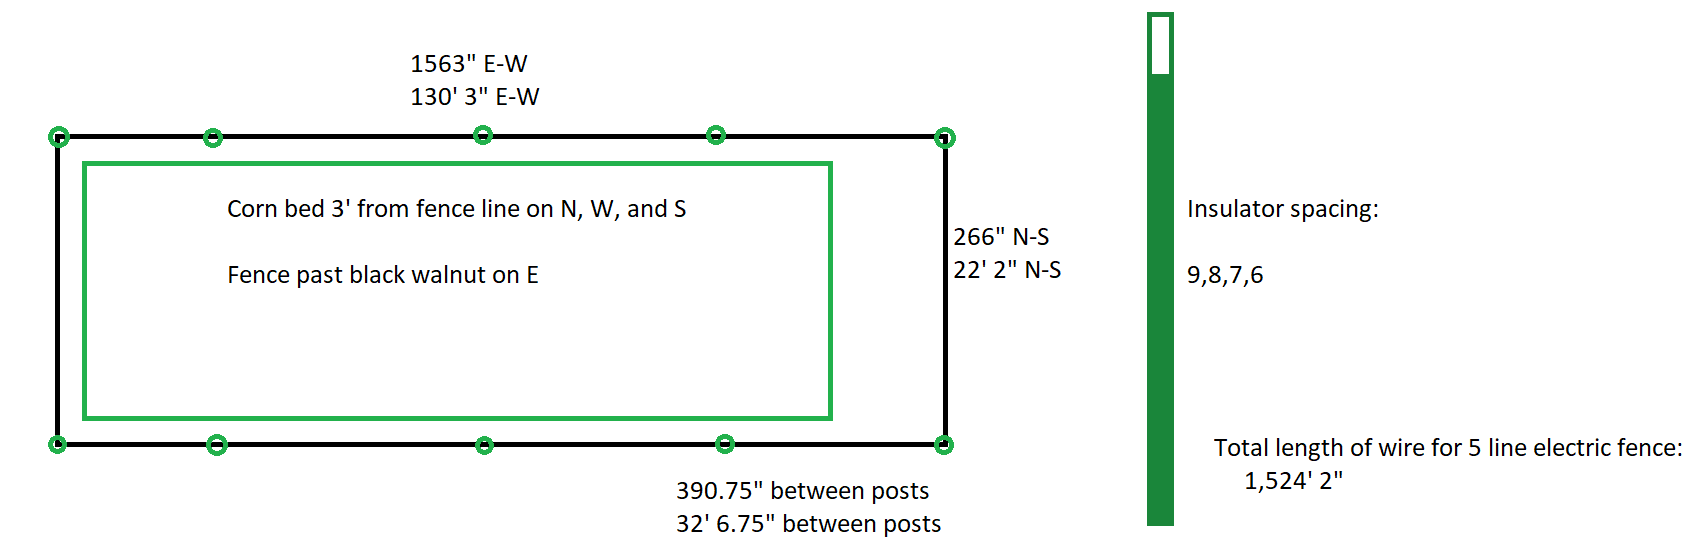
We put an electric fence up around our corn on the farm — wanted to document what we’ve got
I calculated the “best deal” on dragon chow berries per fake gold coin in Anya’s DragonMania Legends game — I always tell her to get Clan Blue Hazel because you don’t need to keep “re-planting” them every couple of minutes, but the spikey cherries that grow in 30 seconds are actually the best “deal”.
| Type | Berries | Coins | Hours | Berries | Coins | Berries per Coin |
| Spikey Cherry | 65 | 195 | 0.008333 | 5 | 15 | 0.333333333 |
| Purplemon | 352 | 1950 | 0.083333 | 27.0769231 | 150 | 0.180512821 |
| Clan Blue Hazel | 2,860 | 19,500 | 2 | 220.00 | 1,500.00 | 0.146666667 |
| Blue Hazel | 2,600 | 19,500 | 2 | 200.00 | 1,500.00 | 0.133333333 |
| Clan Sour Cone | 1105 | 9750 | 0.5 | 85 | 750 | 0.113333333 |
| Sour Cone | 975 | 9750 | 0.5 | 75 | 750 | 0.1 |
| Dragonscale | 5,200 | 52,000 | 6 | 400.00 | 4,000.00 | 0.1 |
| Dragonlandic Berry | 19,500 | 195,000 | 12 | 1,500.00 | 15,000.00 | 0.1 |
| Clan Star Fruit | 71,500 | 780,000 | 24 | 5,500.00 | 60,000.00 | 0.091666667 |
| Star Fruit | 65,000 | 780,000 | 24 | 5,000.00 | 60,000.00 | 0.083333333 |
| Sweetroot | 650,000 | 10,400,000 | 48 | 50,000.00 | 800,000.00 | 0.0625 |
| Candied Pear | 390,000 | 7,500,000 | 42 | 130,000.00 | 2,500,000.00 | 0.052 |
| Spring Cherry | 97,500 | 2,600,000 | 1 | 7,500.00 | 200,000.00 | 0.0375 |
| Clan Royal Fig | 396,000 | 10,800,000 | 24 | 132,000.00 | 3,600,000.00 | 0.036666667 |
| Royal Fig | 360,000 | 10,800,000 | 24 | 120,000.00 | 3,600,000.00 | 0.033333333 |
| Squarey Berry | 120,000 | 4,800,000 | 6 | 40,000.00 | 1,600,000.00 | 0.025 |
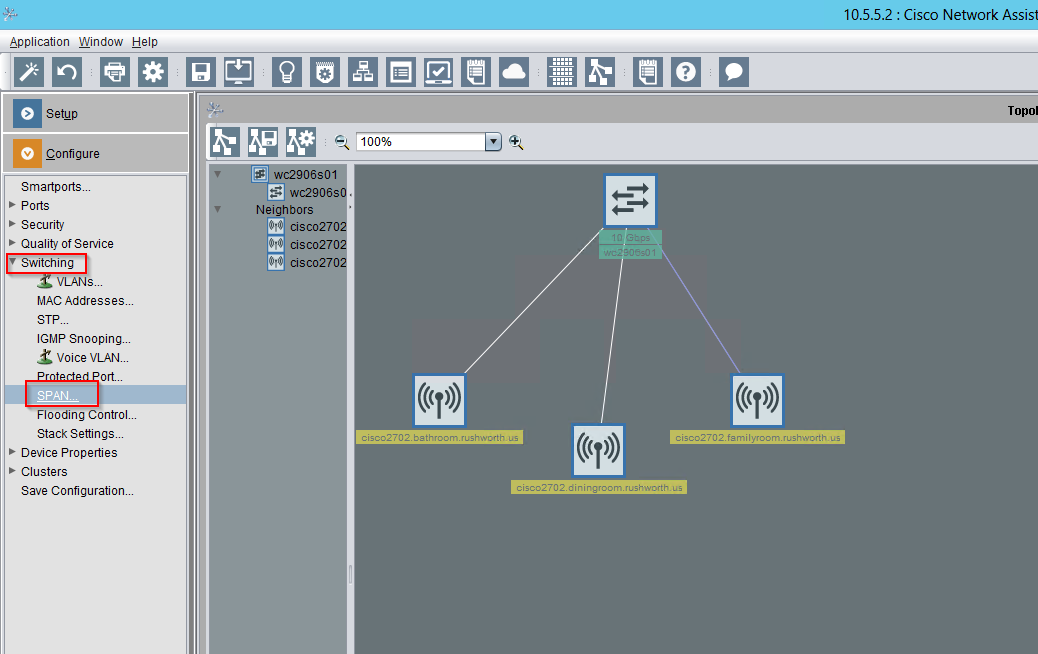
We had an issue where an IOT device was not able to establish the connection it wanted — it would report it couldn’t connect to the Internet. I knew it could connect to the Internet in general; but, without knowing what tiny part of the Internet it used to determine ‘connected’ or ‘not connected’, we were stuck. Except! We recently upgraded the switch in our house to a Cisco Catalyst 2960S — which allows me to do one of the cool things I’d seen the network guys at work do but had never been able to reproduce at home: using SPAN (Switched Port ANalyzer). When we’d encounter strange behavior with a network device where we couldn’t just install Wireshark and get a network capture, the network group would basically clone all of the traffic sent to the device’s port to another switch port where we could capture traffic. They would send me a capture file, and it was just like having a Wireshark capture.
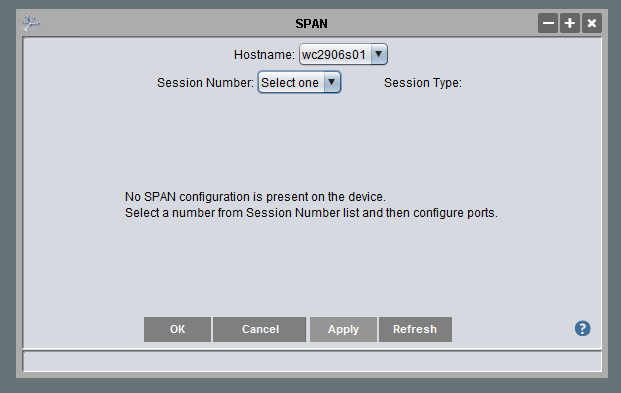
You can set up SPAN from the command line configuration, but I don’t have a username/password pair to log into SSH (and can only establish this from the command line configuration). Before breaking out the Cisco console cable, I tried running Cisco Network Assistant (unfortunately, a discontinued product line). One of the options under “Configure” => “Switching” is SPAN:
Since there was no existing SPAN session, I had to select a session number.
Then find the two ports — in the Ingress/Egress/Destination column, the port that is getting the traffic you want needs to either have Ingress (only incoming traffic), Egress (only outgoing traffic), or Both (all traffic). The port to which you want to clone the traffic is set to Destination. And the destination encapsulation is Replicate. Click apply.
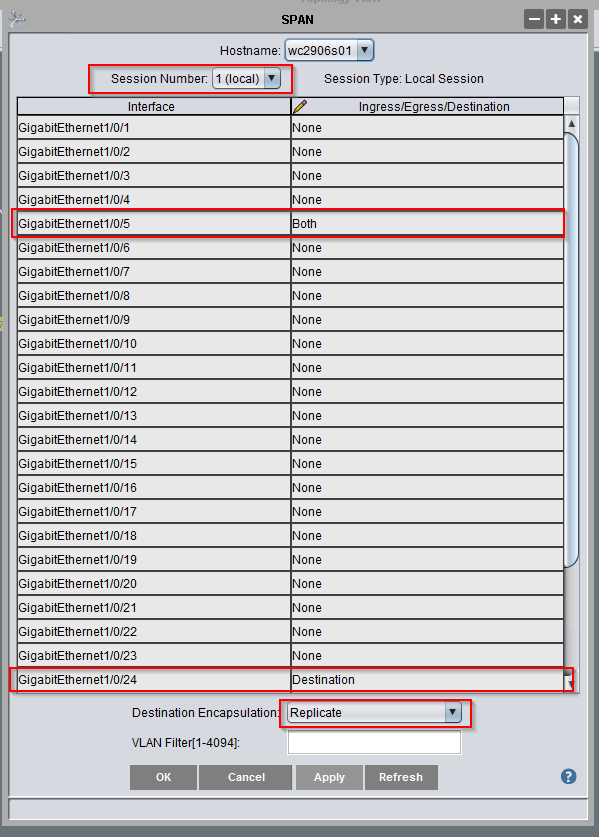
In the example above, the laptop plugged in to GE1/0/24 gets all of the traffic traversing GE1/0/5 — running tshark -w /tmp/TheProblem.cap writes the packet capture to a file for later analysis. Caveat — the destination port is no longer “online” — it receives traffic but isn’t sending or receiving its own traffic … so make sure you aren’t using remote access to control the device!
To remove the SPAN, change the Ingress/Egress/Destination values back to “none”, change the destination encapsulation back to select one, and apply.
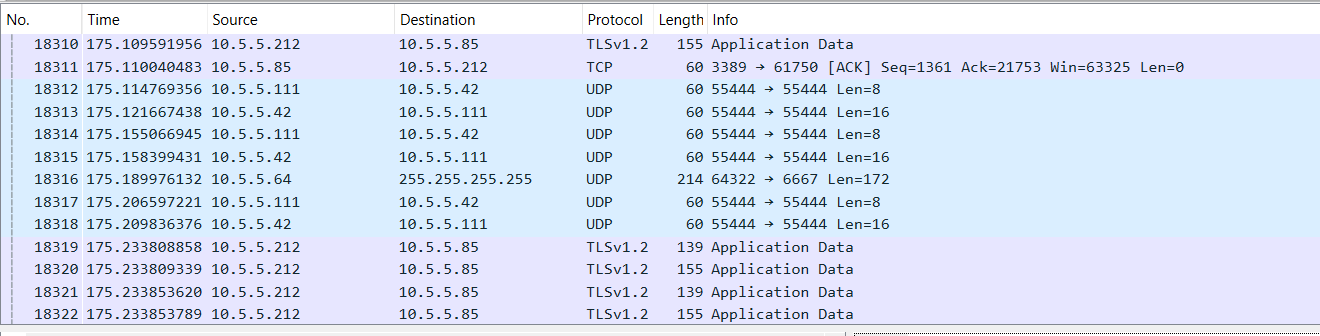
Since the source port is connected to one of our wireless access points, the network capture encompasses all wireless traffic through that access point.
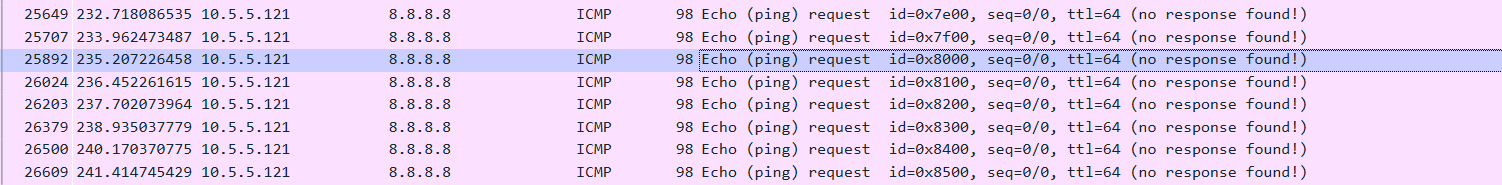
And we were easily able to identify that this particular device uses the rule “I can ping 8.8.8.8” to determine if it is connected to the Internet. We were able to identify a firewall rule that prevented ICMP replies; allowing this traffic immediately allowed the devices to connect as expected.
I like the sysinternals tools — I use them frequently at work. But, generally? When trying to look at the running Windows processes or how much memory is being used … I need a really small, simple tool that doesn’t add to the bogging that’s already happening. Which is why I hate when people replace taskmgr.exe with the SysInternals task manager on steroids. It’s too much information. The worst part is that the menu option to replace task manager doesn’t un-replace it.
To accomplish that — to revert to the real Windows task manager — you need to edit the registry. Navigate to HKLM\SOFTWARE\Microsoft\Windows NT\CurrentVersion\Image File Execution Options\taskmgr.exe and remove the key named “Debugger” which points to the SysInternals binary.
Attempting to upgrade Tableau from 2021.something to 2022.3.5 repeatedly failed with the following error in the upgrade log:
Failed with the error "Detected the old version of Tableau Server takes precedence on the system PATH".
And there were all sorts of things online to try — most of which involved changing the environment variables Tableau sets. But they weren’t wrong … or, rather, it was impossible to tell which was “right”: the new version I was trying to install or the old version that was still running. On a whim, I thought I’d try an admin-level command prompt. Opening the command prompt with the “Run as administrator” option allowed me to upgrade the server.
Except … I upgraded another server the next night. I knew to launch the command prompt in administrator mode, but I was incredibly dismayed to encounter the exact same error. Even using an admin level command prompt. Then it occurred to me — Windows evaluates the environment variables when you launch the shell (in fairness, every Unix/Linux variant I’ve encountered does the same thing). The installer must be changing the Tableau environment variables. If you use a command prompt that was open prior to running the installer … you don’t have the new values. You have the old ones — so the environment variable, as seen by the upgrade script, is pointing to an older version of Tableau. Launch a new command prompt, re-evaluate the environment variables, and the script now sees the proper version. Hopefully my next upgrade won’t include a panic inducing “yeah, that’s not gonna happen” error!
For some reason, I am given a lot of Kafka instances that no one knows what they are or what they do. The first step, generally, is figuring out if it does anything. Because a server that no one has sent a message to in a year or two … well, there’s not much point in bringing it up to standard, monitoring it, and such. My first glance analysis has been just counting all of the messages in all of the topics to see which topics are actually used — quick bash script to accomplish this (presuming a Kafka broker is on port 9092 of the host running the script)
strTopics=$(./kafka-topics.sh --list --bootstrap-server $(hostname):9092)

SAVEIFS=$IFS
IFS=$'\n'
arrayTopics=($strTopics)
IFS=$SAVEIFS

for i in "${arrayTopics[@]}"; do iMessages=`./kafka-console-consumer.sh --bootstrap-server $(hostname):9092 --topic $i --property print.timestamp=true --from-beginning --timeout-ms=10000 2>&1 | grep "Processed a total of"`;         echo "$i     $iMessages"; done
Since I seem to frequently acquire orphaned platforms with no documentation, I figure it would be good to figure out how to investigate an unknown NEO4J platform to see what it’s got. “SHOW” is very useful in these cases. The full list of SHOW commands is:
"ALIAS"
"ALIASES"
"ALL"
"BTREE"
"BUILT"
"CONSTRAINT"
"CONSTRAINTS"
"CURRENT"
"DATABASE"
"DATABASES"
"DEFAULT"
"EXIST"
"EXISTENCE"
"EXISTS"
"FULLTEXT"
"FUNCTION"
"FUNCTIONS"
"HOME"
"INDEX"
"INDEXES"
"KEY"
"LOOKUP"
"NODE"
"POINT"
"POPULATED"
"PRIVILEGE"
"PRIVILEGES"
"PROCEDURE"
"PROCEDURES"
"PROPERTY"
"RANGE"
"REL"
"RELATIONSHIP"
"ROLE"
"ROLES"
"SERVER"
"SERVERS"
"SETTING"
"SETTINGS"
"SUPPORTED"
"TEXT"
"TRANSACTION"
"TRANSACTIONS"
"UNIQUE"
"UNIQUENESS"
"USER"
"USERS"
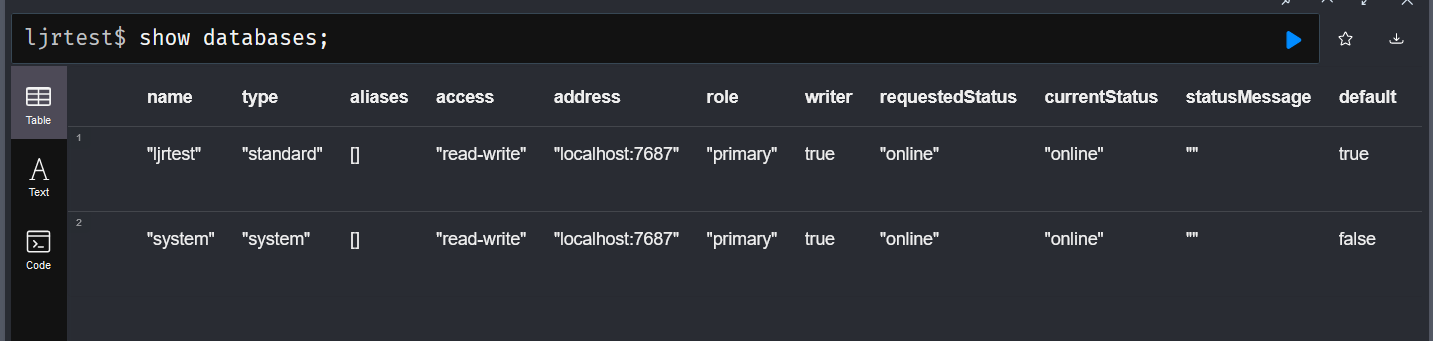
The most useful ones for figuring out what you’ve got … the “show databases” command I know from MySQL/MariaDB does what I expected – you can also include a specific database name, but “show database ljrtest” doesn’t appear to list any more information than the generic show databases command. .
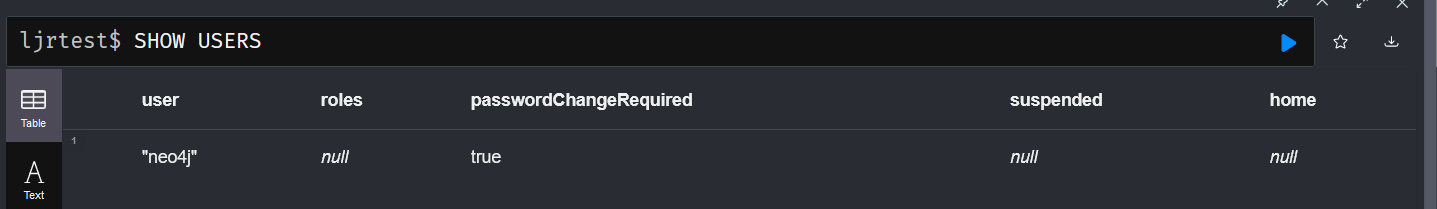
There’s also a “show users” command that outputs the users in the database – although I’m using the community edition without authentication, so there isn’t much interesting information being output here.
And roles, if roles are being used, should be output with “SHOW ALL ROLES” … but mine just says “Unsupported administration command”
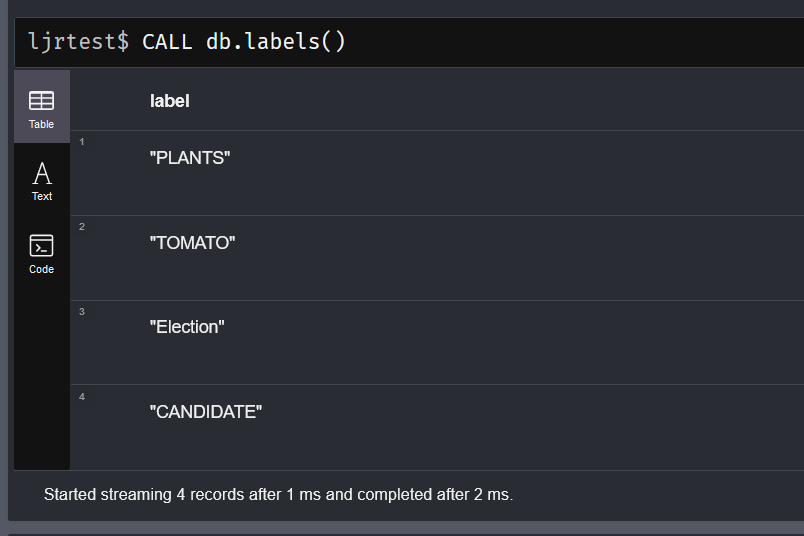
Once you know what databases you’ve got and who can log in and do stuff, we’d want to look at the data. There are some built-in functions that will help us out here. The db.labels() function will list the labels in the selected database.
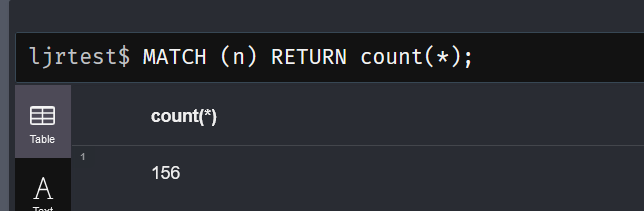
You can also return a distinct list of labels along with the count of nodes with that label:
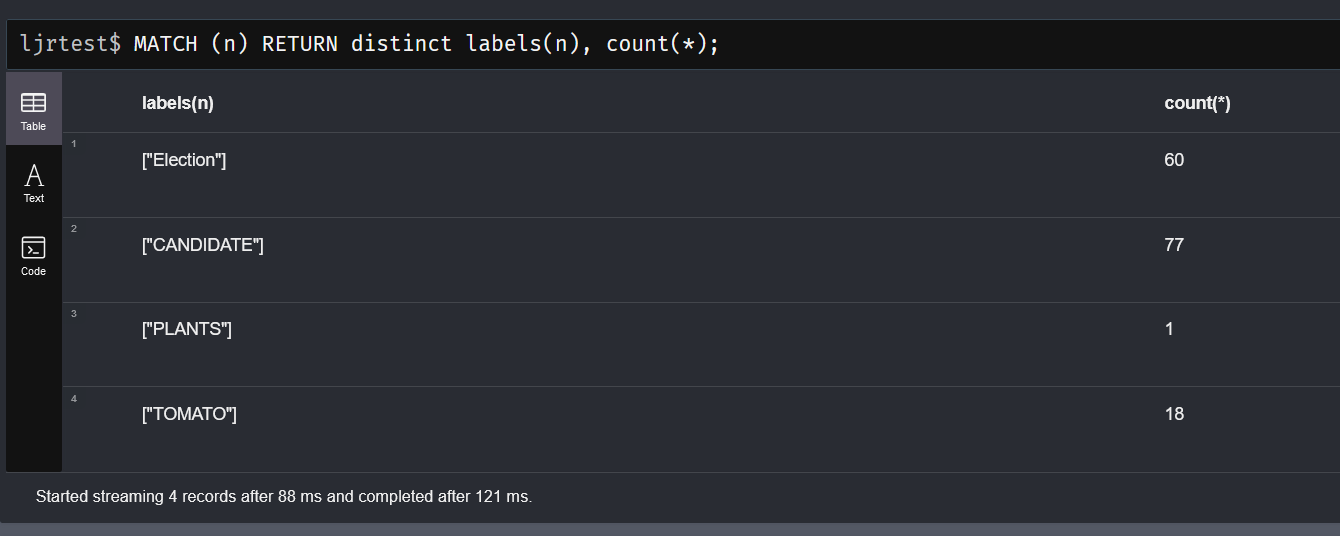
Since a node can have multiple, comparing that total with a count of nodes would give you an idea if there are many more labels than nodes. In my case, either view shows 156 … so I know there are few (if any) nodes with multiple labels.
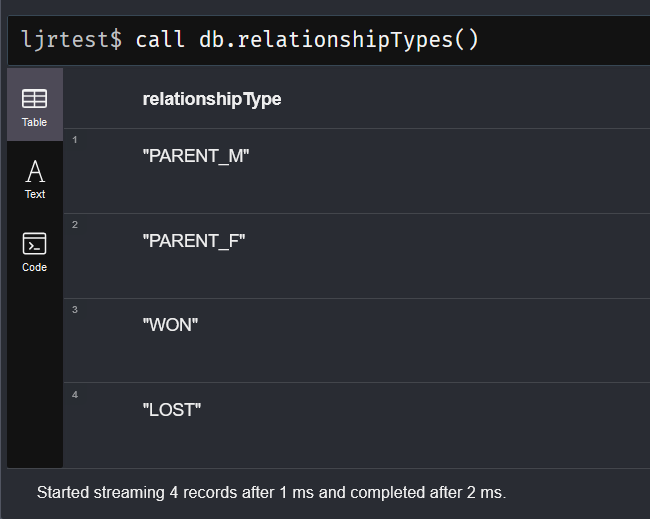
To view the types of relationships defined in the selected database, use “CALL db.relationshipTypes()”
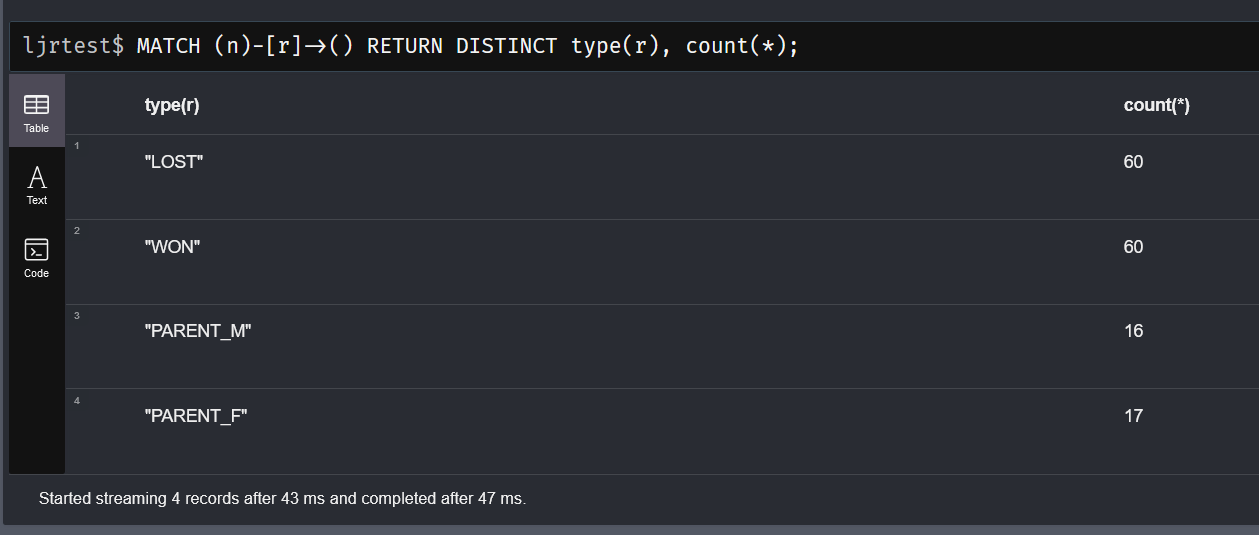
Similarly, you can return the relationship types along with counts
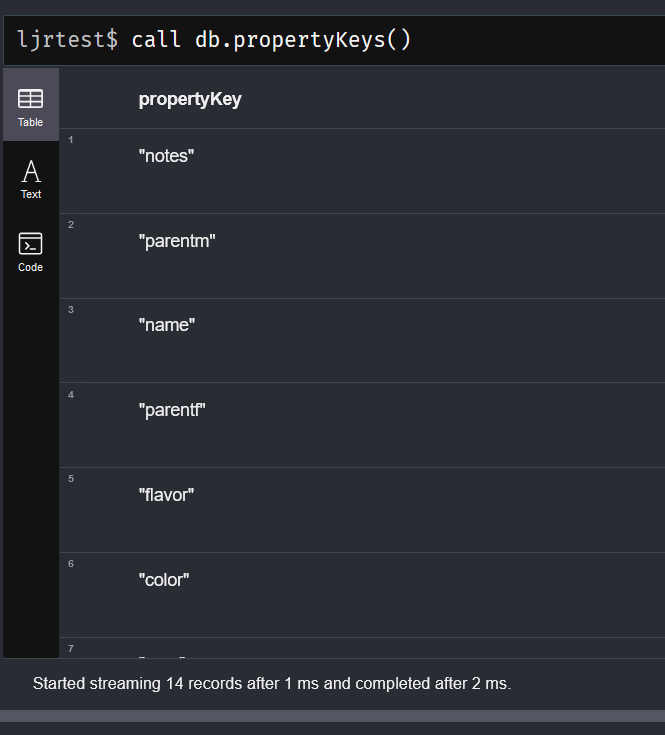
There is a function to list the property keys used within the data – interesting to note that keys that were used but the nodes using them were subsequently deleted … they still show up as property keys. Basically, anything that is there is on this list but some things on this list may not be there anymore. In this example, ‘parentm’ and ‘parentf’ were labels I used to build relationships programmatically.
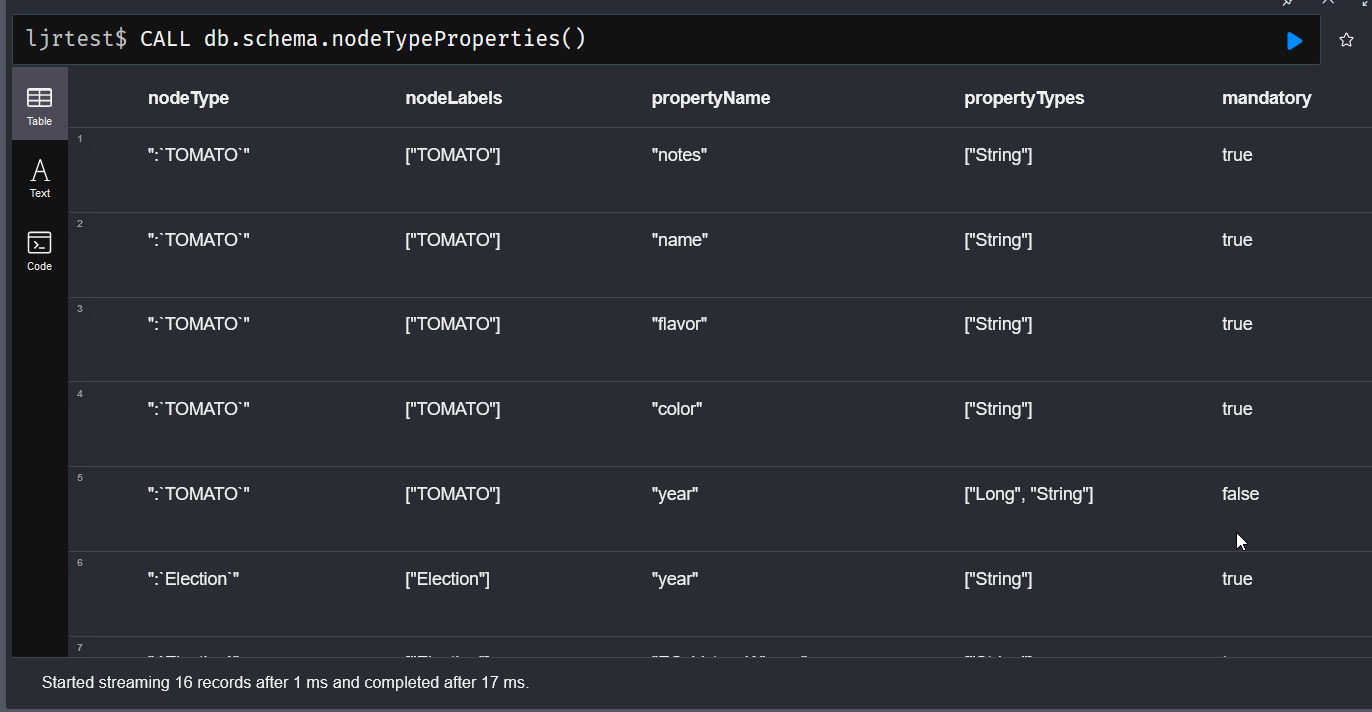
I’ve found db.schema.nodeTypeProperties to be more useful in this regard – it does not appear to list properties that are not in use, and the output includes field types
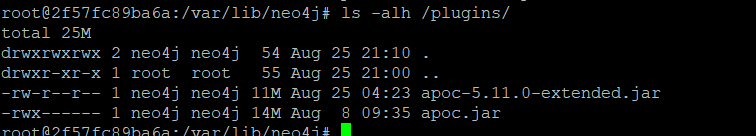
To see if there are any custom procedures or functions registered, look on the server(s). Use ps -efww to view the running command – there will be some folders listed after “-cp” … you could find procedures or plugins in any of those folders. In my case, the plugins are in /plugins

And the only “custom” things registered are the APOC and APOC-Extended jar’s
I frequently need to find details on a data source based on its name and find all data sources of a particular type. Particularly, the Microsoft Graph permissions required to use Sharepoint and OneDrive data within Tableau changed — I needed to reach out to individuals who use those data types to build a business case for the Security organization to approve the new permissions be added to our tenant.
-- Query to find all data sources of a specific type or name
select system_users.email, datasources.id, datasources.name, datasources.created_at, datasources.updated_at, datasources.db_class, datasources.db_name
, datasources.site_id, sites.name as SiteName, projects.name as ProjectName, workbooks.name as WorkbookName
from datasources
left outer join users on users.id = datasources.owner_id
left outer join system_users on users.system_user_id = system_users.id
left outer join sites on datasources.site_id = sites.id
left outer join projects on datasources.project_id = projects.id
left outer join workbooks on datasources.parent_workbook_id = workbooks.id
-- where datasources.name like '%Sheet1 (LJR Sample%'
where datasources.db_class = 'onedrive'
order by datasources.name
;