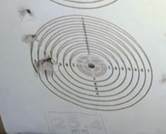
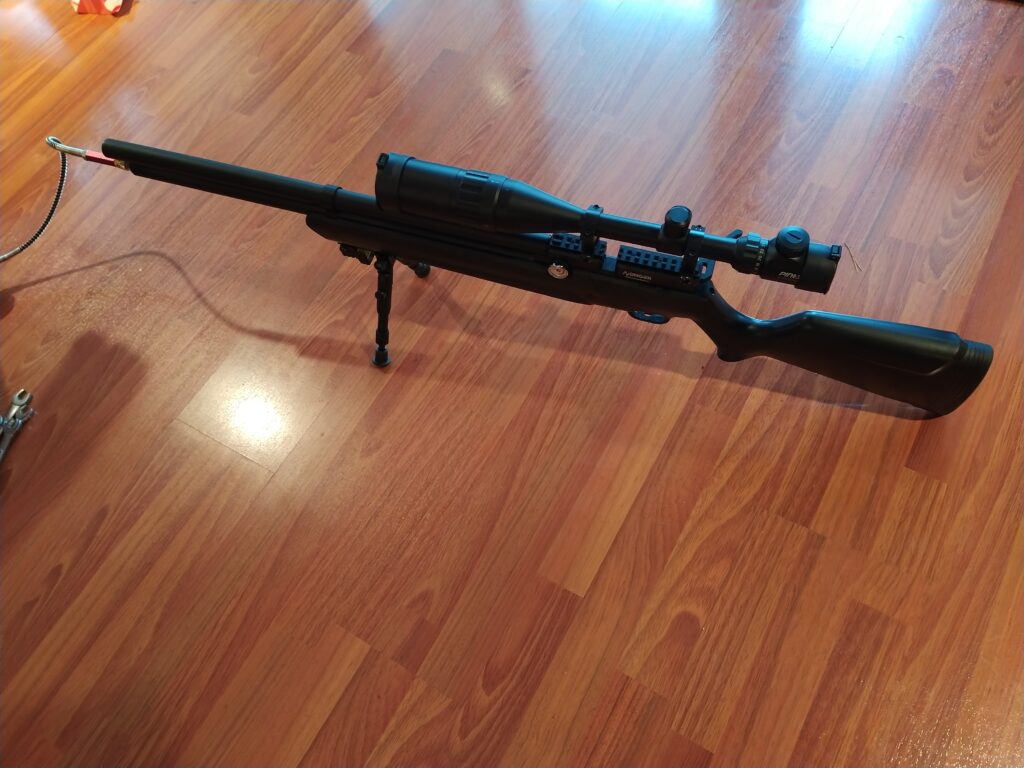
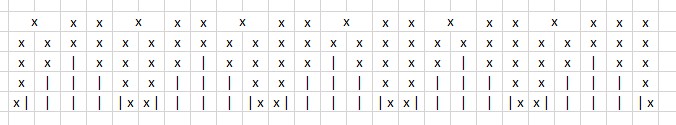
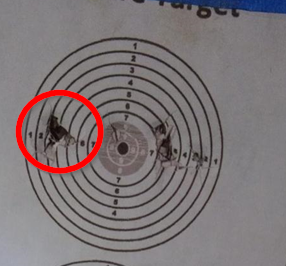
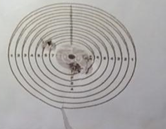
We tested various regulator pressure and hammer spring combinations to see where we get the best accuracy. Using 19.91 grain H&N Barracuda Green pellets. Looks like 1200 psi with the hammer spring two turns in wins.
1200 psi:
Hammer spring at 1 turn:
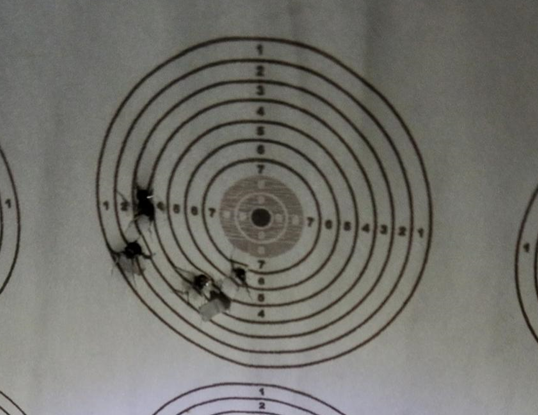
Left side of top right target has hammer spring at 2 turns.
Right side of top right target has hammer spring at 3 turns.
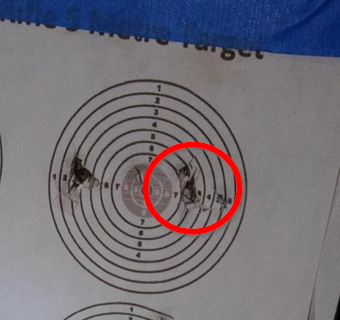
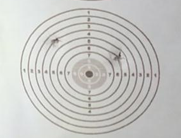
1400 psi:
Hammer spring at 2 turns.
Hammer spring at 3 turns
1800 psi:
Hammer spring at 1 turn