Month: April 2023

Predicting the Future

That didn’t take longhttps://www.engadget.com/three-samsung-employees-reportedly-leaked-sensitive-data-to-chatgpt-190221114.html

Leaking data is obviously a big problem if the user base is “anyone with an internet connection”, but potentially not great even for an internal implementation of an AI chatbot.

Content management platforms, in the early days, had a big problem with search because the indexing engine had super-user rights – so searching for “acquisition” would give you links that you couldn’t read. Even if the titles didn’t tell you anything (does “Project OPUS” or “Project Golden Falcon” have any meaning to you?), the dates & authors told you something (hey, there’s a bunch of new docs the C-levels are creating about acquisitions this past few weeks … sure that doesn’t mean anything!). Eventually any halfway decent content management platform understood permissions and at least attempts to filter results based on what you have permission to view.

AI is different, unfortunately in a way that makes implementing that type of security more difficult. Other than individualizing the trained AIs for each user (so info you feed in is only going to be reflected in your future results) or not training based on user input (only use stuff that’s openly readable already) … it would be rather challenging to filter an implementation so it knows stuff it’s been told but doesn’t convey that information to unauthorized individuals.
Increasing Kibana CSV Report Max Size

The default size limit for CSV reports in Kibana is 10 meg. Since that’s not enough for some of our users, I’ve been testing increases to the xpack.reporting.csv.maxSizeBytes value.

We’re still limited by the ES http.max_content_length value — which the documentation seems pretty confident shouldn’t be increased because the system can become unstable. Increasing the max Kibana report size to 100mb just yields a different error because ES doesn’t like it. 75 exhausted the JavaScript heap (?) – which I could get around by setting  NODE_OPTIONS=–max_old_space_size=4096 … but that just led to the server abending whenever a report was run (in fact, I had to remove the reports I tried to run from the server to get everything back into a working state). Increasing the limit to 50 meg, though, didn’t do anything unreasonable in dev. So somewhere between 50 and 75 meg is our upper limit, and 50 seemed like a nice round number to me.

Notes on resource usage – Data is held in memory as a report is created. We’d see an increase in memory/CPU usage while the report is being generated (or, I guess more accurately, a longer time during which the memory/CPU usage is increased because if a 10 meg report takes 30 seconds to run then a 50 meg report is going to take 2.5 minutes to run … and the memory/CPU usage is pretty much the same during the “a report is running” period).

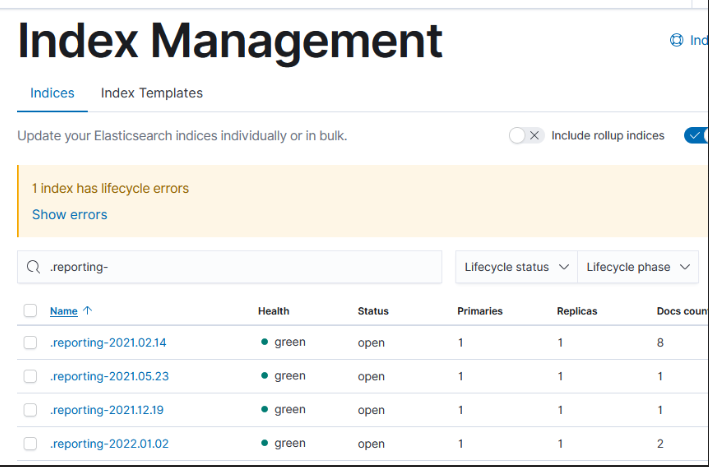
Then, though, the report is stashed in ElasticSearch for user(s) to retrieve within .reporting* indicies. And that’s where things get a little silly — architecturally, this is just another index; it ages off with a lifecycle policy if one exists. But it looks like they never created a lifecycle management policy. So you can still retrieve reports run a little over two years ago! We will certainly want to set up a policy to clean up old reports … just have to decide how long is reasonable.


Using Excel to turn week of month and day of week into actual dates

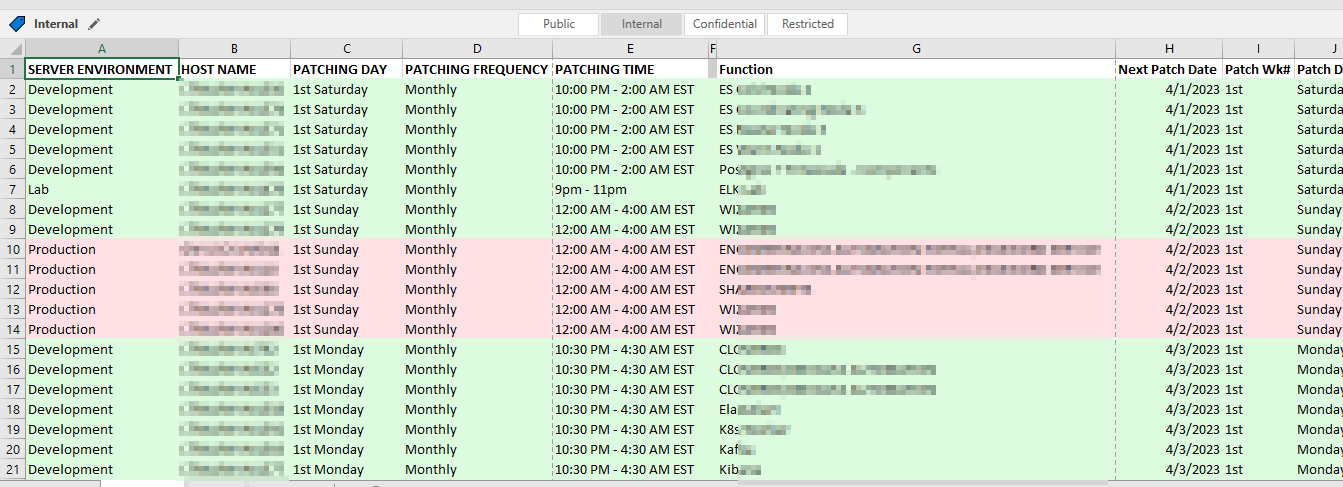
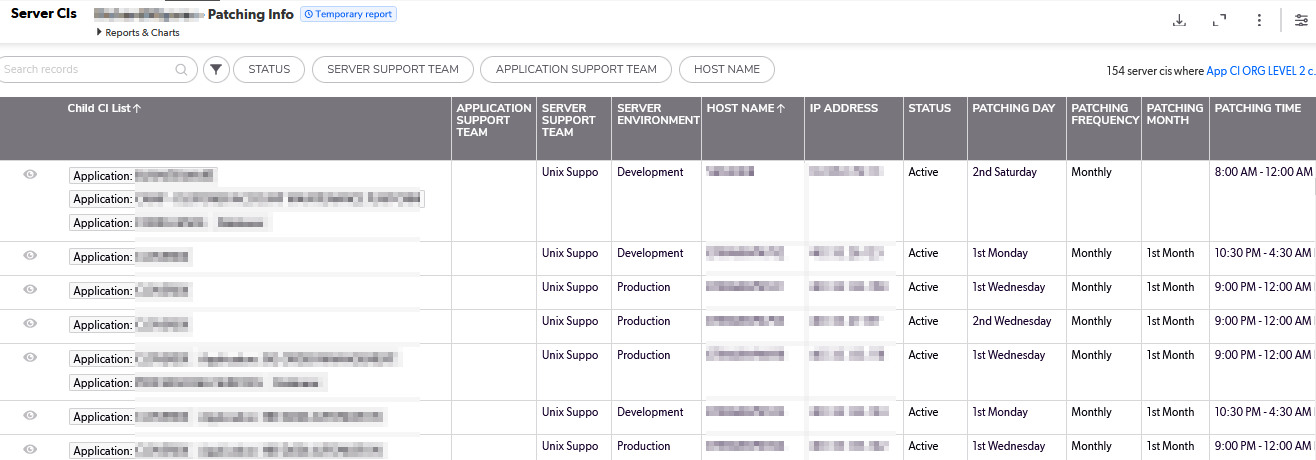
Our patching schedules are algorithmic – the 1st Tuesday of the month, the 3rd Wednesday of the month, etc. But that’s not particularly useful for notifying end users or for us to verify functionality after patching.

Graphical user interface, table Description automatically generated

Long term, I think we can pull the source data from a database and create appointment items each month for whatever list of servers will be patched that month based on a relative date (so no one has to add new servers or remove decommissioned servers). But, short term? I really wanted a way to see what date a server would be patched. So I created a but of a convoluted spreadsheet to produce this information based on a list of servers and patching schedule patterns.

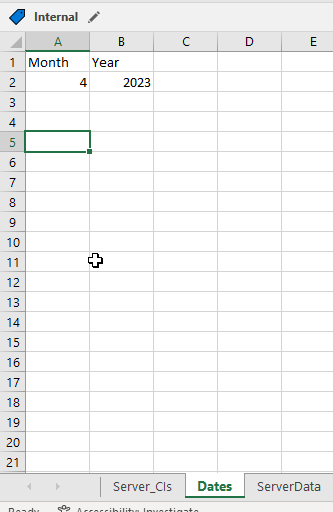
There are two “extra” tabs used – “Dates” used to say what month and year I want the patching dates for

Graphical user interface, application, table, Excel Description automatically generated

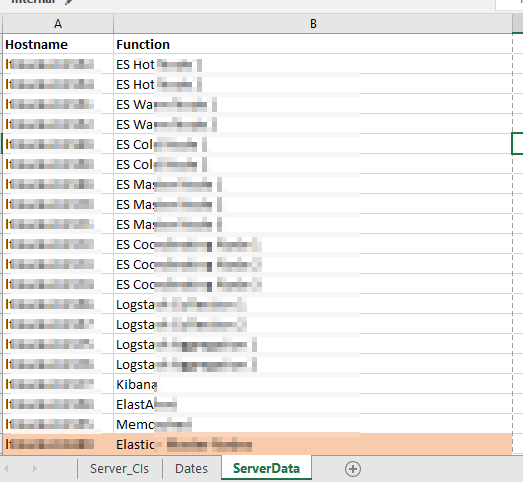
And “ServerData” which provides a cross-reference between the server names and a useful description.

Graphical user interface, application, table, Excel Description automatically generated

There are then a series of formulae used to add columns to our source data. First, the “Function” is populated in column G with a VLOOKUP =VLOOKUP(B2,ServerData!A:B,2,FALSE)

Columns I and J break the “1st Saturday” into the two components – week of month and day of week –

I =LEFT(C2,3)
J =RIGHT(C2,LEN(C2)-4)

Columns K and L then map these components into numeric values I can use in a formula:

K =IF(I2=”1st”,1,IF(I2=”2nd”,2,IF(I2=”3rd”,3,IF(I2=”4th”,4,”Unscheduled”))))
L =IF(J2=”Sunday”,1,IF(J2=”Monday”,2,IF(J2=”Tuesday”,3,IF(J2=”Wednesday”,4,IF(J2=”Thursday”,5,IF(J2=”Friday”,6,IF(J2=”Saturday”,7,”Unscheduled”)))))))

And finally a formula in column H that turns the week of month and day of week values into an actual date within the month and year on the “Dates” tab:

H =DATE(Dates!$B$2,Dates!$A$2,1+7*K2)-WEEKDAY(DATE(Dates!$B$2,Dates!$A$2,8-L2))

Voila – I have a spreadsheet that says we should expect to see this specific list of servers being patched tonight.

Graphical user interface, application, table, Excel Description automatically generated