Month: June 2022

NGINX Auth Proxy

This example uses Kerberos for SSO authentication using Docker-ized NGINX. To instantiate the sandbox container, I am mapping the conf.d folder into the container and publishing ports 80 and 443

docker run -dit --name authproxy -v /usr/nginx/conf.d:/etc/nginx/conf.d -p 80:80 -p 443:443 -d centos:latest

Shell into the container, install Kerberos, and configure it to use your domain (in this example, it is my home domain.

docker exec -it authproxy bash

# Fix the repos – this is a docker thing, evidently …
cd /etc/yum.repos.d/
sed -i 's/mirrorlist/#mirrorlist/g' /etc/yum.repos.d/CentOS-*
sed -i 's|#baseurl=http://mirror.centos.org|baseurl=http://vault.centos.org|g' /etc/yum.repos.d/CentOS-*
# And update everything just because
dnf update
# Install required stuff
dnf install vim wget git gcc make pcre-devel zlib-devel krb5-devel

Install NGINX from source and include the spnego-http-auth-nginx-module module

wget http://nginx.org/download/nginx-1.21.6.tar.gz
gunzip nginx-1.21.6.tar.gz
tar vxf nginx-1.21.6.tar
cd nginx-1.21.6/
git clone https://github.com/stnoonan/spnego-http-auth-nginx-module.git
dnf install gcc make pcre-devel zlib-devel krb5-devel
./configure --add-module=spnego-http-auth-nginx-module
make
make install

Configure Kerberos on the server to use your domain:

root@aadac0aa21d5:/# cat /etc/krb5.conf
includedir /etc/krb5.conf.d/
[logging]
default = FILE:/var/log/krb5libs.log
kdc = FILE:/var/log/krb5kdc.log
admin_server = FILE:/var/log/kadmind.log
[libdefaults]
dns_lookup_realm = false
ticket_lifetime = 24h
renew_lifetime = 7d
forwardable = true
rdns = false
default_realm = EXAMPLE.COM
# allow_weak_crypto = true
# default_tgs_enctypes = arcfour-hmac-md5 des-cbc-crc des-cbc-md5
# default_tkt_enctypes = arcfour-hmac-md5 des-cbc-crc des-cbc-md5
default_ccache_name = KEYRING:persistent:%{uid}
[realms]
EXAMPLE.COM= {
   kdc = DC01.EXAMPLE.COM
   admin_server = DC01.EXAMPLE.COM
}

Create a service account in AD & obtain a keytab file:

ktpass /out nginx.keytab /princ HTTP/docker.example.com@example.com -SetUPN /mapuser nginx /crypto AES256-SHA1 /ptype KRB5_NT_PRINCIPAL /pass Th2s1sth3Pa=s -SetPass /target dc01.example.com

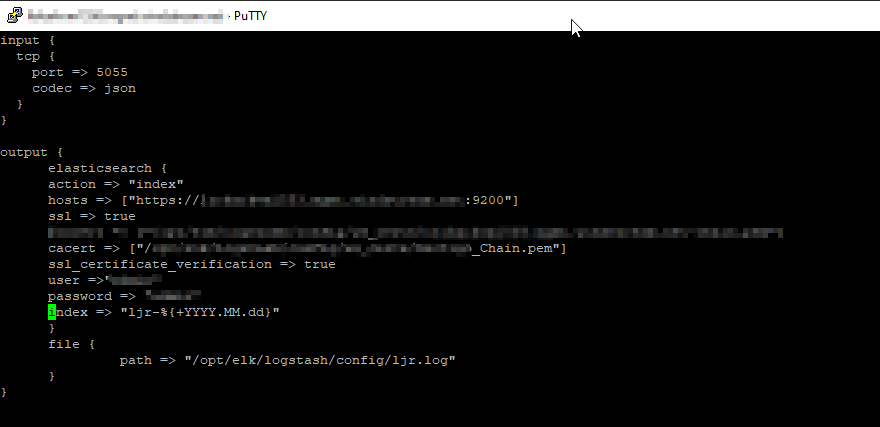
Transfer the keytab file to the NGINX server. Add the following to the server{} section or location{} section to require authentication:

auth_gss on;
auth_gss_keytab /path/to/nginx/conf/nginx.keytab;
auth_gss_delegate_credentials on;

You will also need to insert header information into the nginx config:

proxy_pass http://www.example.com/authtest/;
proxy_set_header Host "www.example.com"; # I need this to match the host header on my server, usually can use data from $host
proxy_set_header X-Original-URI $request_uri; # Forward along request URI
proxy_set_header X-Real-IP $remote_addr; # pass on real client's IP
proxy_set_header X-Forwarded-For "LJRAuthPrxyTest";
proxy_set_header X-Forwarded-Proto $scheme;
proxy_set_header Authorization $http_authorization;
proxy_pass_header Authorization;
proxy_set_header X-WEBAUTH-USER $remote_user;
proxy_read_timeout 900;

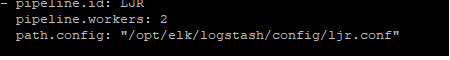
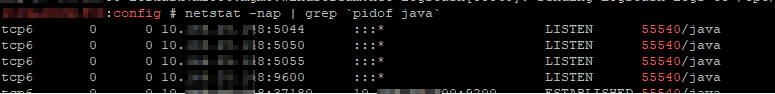
Run NGINX: /usr/local/nginx/sbin/nginx

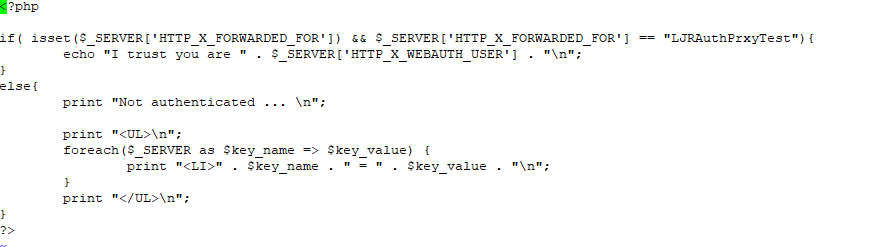
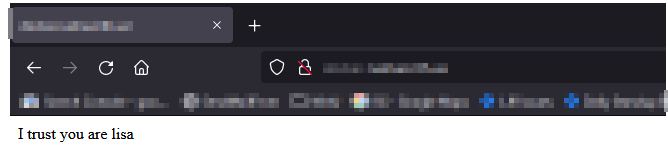
In and of itself, this is the equivalent of requiring authentication – any user – to access a site. The trick with an auth proxy is that the server must trust the header data you inserted – in this case, I have custom PHP code that looks for X-ForwardedFor to be “LJRAuthPrxyTest” and, if it sees that string, reads X-WEBAUTH-USER for the user’s logon name.

In my example, the Apache site is configured to only accept connections from my NGINX instance:

<RequireAll>
     Require ip 10.1.3.5
</RequireAll>

This prevents someone from playing around with header insertion and spoofing authentication.

Some applications allow auth proxying, and the server documentation will provide guidance on what header values need to be used.


Making Statistics Work for You

The local newspaper had a poll (in a heavily Republican area) asking if readers support gun control — now they didn’t define “gun control”, so it’s possible some individuals said “no” because they envisioned something unreasonably restrictive or some said “yes” because they think ‘gun control’ includes arming teachers in classrooms or something. Based on the way they elected to bucket the data, there’s no clear “winner”.

But looking at it as just ‘yes’ or ‘no’ — almost 80% of the readers said “yes”

They could break it out by party affiliation and show that only 10% of self-identified Democrats said they don’t support gun control where 28% of self-identified independents and 24% of self-identified Republicans don’t support gun control.

But any of these charts clearly show that a significant majority supports some type of gun control.

Upgrading Logstash

The process to upgrade minor releases of LogStash is quite simple — stop service, drop the binaries in place, and start service. In this case, my upgrade process is slightly complicated by the fact our binaries aren’t installed to the “normal” location from the RPM. I am upgrading from 7.7.0 => 7.17.4

The first step is, obviously, to download the LogStash release you want – in this case, it is 7.17.4 as upgrading across major releases is not supported.


cd /tmp
mkdir logstash
mv logstash-7.17.4-x86_64.rpm ./logstash

cd /tmp/logstash
rpm2cpio logstash-7.17.4-x86_64.rpm | cpio -idmv

systemctl stop logstash
mv /opt/elk/logstash /opt/elk/logstash-7.7.0
mv /tmp/logstash/usr/share/logstash /opt/elk/
mkdir /var/log/logstash
mkdir /var/lib/logstash

mv /tmp/logstash/etc/logstash /etc/logstash
cd /etc/logstash
mkdir rpmnew
mv jvm.options ./rpmnew/
mv log* ./rpmnew/
mv pipelines.yml ./rpmnew/
mv startup.options ./rpmnew/
cp -r /opt/elk/logstash-7.7.0/config/* ./

ln -s /opt/elk/logstash /usr/share/logstash
ln -s /etc/logstash /opt/elk/logstash/config

chown -R elasticsearch:elasticsearch /opt/elk/logstash
chown -R elasticsearch:elasticsearch /var/log/logstash
chown -R elasticsearch:elasticsearch /var/lib/logstash
chown -R elasticsearch:elasticsearch /etc/logstash

systemctl start logstash
systemctl status logstash
/opt/elk/logstash/bin/logstash --version

Using FileBeat to Send Data to ElasticSearch via Logstash

Before sending data, you need a pipleline on logstash to accept the data. If you are using an existing pipeline, you just need the proper host and port for the pipeline to use in the Filebeat configuration. If you need a new pipeline, the input needs to be of type ‘beats’

# Sample Pipeline Config:
input {
  beats   {
    host => "logstashserver.example.com"
    port => 5057
    client_inactivity_timeout => "3000"
  }
}

filter {
  grok{
     match => {"message"=>"\[%{TIMESTAMP_ISO8601:timestamp}] %{DATA:LOGLEVEL} \[Log partition\=%{DATA:LOGPARTITION}, dir\=%{DATA:KAFKADIR}\] %{DATA:MESSAGE} \(%{DATA:LOGSOURCE}\)"}
  }
}

output {
  elasticsearch {
    action => "index"
    hosts => ["https://eshost.example.com:9200"]
    ssl => true
    cacert => ["/path/to/certs/CA_Chain.pem"]
    ssl_certificate_verification => true
    user =>"us3r1d"
    password => "p@s5w0rd"
    index => "ljrkafka-%{+YYYY.MM.dd}"
  }
}


Download the appropriate version from https://www.elastic.co/downloads/past-releases#filebeat – I am currently using 7.17.4 as we have a few CentOS + servers.

Install the package (rpm -ihv filebeat-7.17.4-x86_64.rpm) – the installation package places the configuration files in /etc/filebeat and the binaries and other “stuff” in /usr/share/filebeat

Edit /etc/filebeat/filebeat.yml

    • Add inputs for log paths you want to monitor (this may be done under the module config if using a module config instead)
    • Add an output for Logstash to the appropriate port for your pipeline:
      output.logstash:
      hosts: [“logstashhost.example.com:5055”]

Run filebeat in debug mode from the command line and watch for success or failure.
filebeat -e -c /etc/filebeat/filebeat.yml -d "*"

Assuming everything is running well, use systemctl start filebeat to run the service and systemctl enable filebeat to set it to launch on boot.

Filebeats will attempt to parse the log data and send a JSON object to the LogStash server. When you view the record in Kibana, you should see any fields parsed out with your grok rule – in this case, we have KAFKADIR, LOGLEVEL, LOGPARTITION, LOGSOURCE, and MESSAGE fields.

Using Logstash to Send Data to ElasticSearch

Create a logstash pipeline

  1. The quickest thing to do is copy the config of a similar use case and adjusted the pipeline port (and adjusted the ES destination index). But, if this is a unique scenario, build a new pipeline configuration. I am creating a TCP listener that receives data from Python using the python-logstash module. In this configuration, logstash will create the index as needed with YYYY-MM-dd appended to the base index name.
    Text

Description automatically generated
  2. Edit the pipelines.yml to register the config you just created
  3. Restart logstash to activate the new pipeline
  4. Use netstat -nap | grep `pidof java` to ensure the server is listening on the new port
  5. Add the port to the runtime firewalld rules and test that the port is functional (firewall-cmd –zone=public –add-port=5055/tcp)
  6. Assuming the runtime rule has not had any unexpected results, register a permanent firewalld rule (firewall-cmd –permanent –zone=public –add-port=5055/tcp)

We now have a logstash data collector ready. We next need to create the index templates in ES

  1. Log into Kibana
  2. Create an ILM policy – this policy rolls indices into the warm phase after 2 days and forces merge. It also deletes records after 20 days.
    { “policy”: { “phases”: { “hot”: { “min_age”: “0ms”, “actions”: { “set_priority”: { “priority”: 100 } } }, “warm”: { “min_age”: “2d”, “actions”: { “forcemerge”: { “max_num_segments”: 1 }, “set_priority”: { “priority”: 50 } } }, “delete”: { “min_age”: “20d”, “actions”: { “delete”: {} } } } } }
  3. Create an index template — define the number of replicas
  4. Send data through the pipeline – the index will get created per the template definitions and document(s) added to the index