Create a logstash pipeline
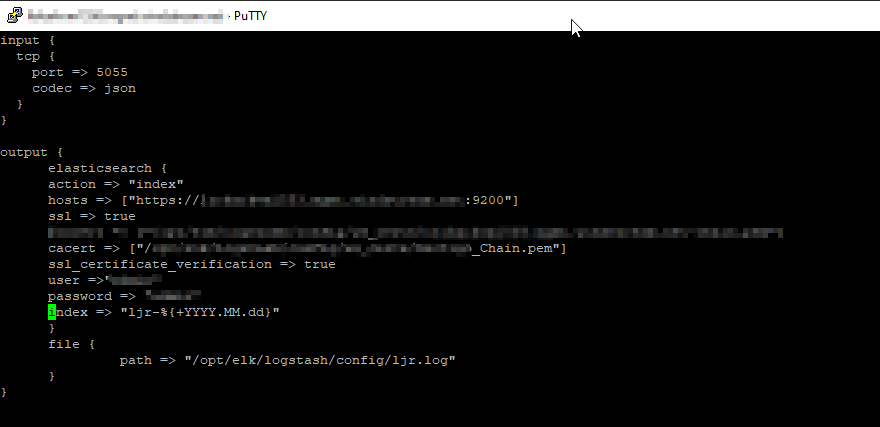
- The quickest thing to do is copy the config of a similar use case and adjusted the pipeline port (and adjusted the ES destination index). But, if this is a unique scenario, build a new pipeline configuration. I am creating a TCP listener that receives data from Python using the python-logstash module. In this configuration, logstash will create the index as needed with YYYY-MM-dd appended to the base index name.
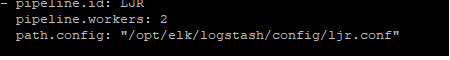
- Edit the pipelines.yml to register the config you just created
- Restart logstash to activate the new pipeline
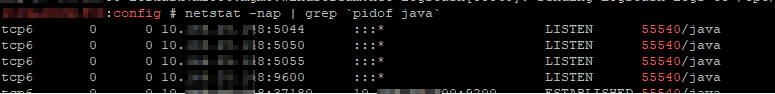
- Use netstat -nap | grep `pidof java` to ensure the server is listening on the new port
- Add the port to the runtime firewalld rules and test that the port is functional (firewall-cmd –zone=public –add-port=5055/tcp)
- Assuming the runtime rule has not had any unexpected results, register a permanent firewalld rule (firewall-cmd –permanent –zone=public –add-port=5055/tcp)
We now have a logstash data collector ready. We next need to create the index templates in ES
- Log into Kibana
- Create an ILM policy – this policy rolls indices into the warm phase after 2 days and forces merge. It also deletes records after 20 days.
{ “policy”: { “phases”: { “hot”: { “min_age”: “0ms”, “actions”: { “set_priority”: { “priority”: 100 } } }, “warm”: { “min_age”: “2d”, “actions”: { “forcemerge”: { “max_num_segments”: 1 }, “set_priority”: { “priority”: 50 } } }, “delete”: { “min_age”: “20d”, “actions”: { “delete”: {} } } } } } - Create an index template — define the number of replicas
- Send data through the pipeline – the index will get created per the template definitions and document(s) added to the index