Create index / reindex status
select * from pg_stat_progress_create_index;
Progress of CREATE INDEX or REINDEX processes are visible in the pg_stat_progress_create_index view. Each backend that is creating indexes will have a row. The following columns will be included in the result set:
| Column |
Type |
Description |
| pid |
integer |
Process ID of backend. |
| datid |
oid |
OID of the database to which this backend is connected. |
| datname |
name |
Name of the database to which this backend is connected. |
| relid |
oid |
OID of the table on which the index is being created. |
| index_relid |
oid |
OID of the index being created or reindexed. During a non-concurrent CREATE INDEX, this is 0. |
| command |
text |
The command that is running: CREATE INDEX, CREATE INDEX CONCURRENTLY, REINDEX, or REINDEX CONCURRENTLY. |
| phase |
text |
Current processing phase of index creation. |
| lockers_total |
bigint |
Total number of lockers to wait for, when applicable. |
| lockers_done |
bigint |
Number of lockers already waited for. |
| current_locker_pid |
bigint |
Process ID of the locker currently being waited for. |
| blocks_total |
bigint |
Total number of blocks to be processed in the current phase. |
| blocks_done |
bigint |
Number of blocks already processed in the current phase. |
| tuples_total |
bigint |
Total number of tuples to be processed in the current phase. |
| tuples_done |
bigint |
Number of tuples already processed in the current phase. |
| partitions_total |
bigint |
When creating an index on a partitioned table, this column is set to the total number of partitions on which the index is to be created. |
| partitions_done |
bigint |
When creating an index on a partitioned table, this column is set to the number of partitions on which the index has been completed. |
The “phase” string will be one of the following:
| Phase |
Description |
| initializing |
CREATE INDEX or REINDEX is preparing to create the index. This phase is expected to be very brief. |
| waiting for writers before build |
CREATE INDEX CONCURRENTLY or REINDEX CONCURRENTLY is waiting for transactions with write locks that can potentially see the table to finish. This phase is skipped when not in concurrent mode. Columns lockers_total, lockers_done and current_locker_pid contain the progress information for this phase. |
| building index |
The index is being built by the access method-specific code. In this phase, access methods that support progress reporting fill in their own progress data, and the subphase is indicated in this column. Typically, blocks_total and blocks_done will contain progress data, as well as potentially tuples_total and tuples_done. |
| waiting for writers before validation |
CREATE INDEX CONCURRENTLY or REINDEX CONCURRENTLY is waiting for transactions with write locks that can potentially write into the table to finish. This phase is skipped when not in concurrent mode. Columns lockers_total, lockers_done and current_locker_pid contain the progress information for this phase. |
| index validation: scanning index |
CREATE INDEX CONCURRENTLY is scanning the index searching for tuples that need to be validated. This phase is skipped when not in concurrent mode. Columns blocks_total (set to the total size of the index) and blocks_done contain the progress information for this phase. |
| index validation: sorting tuples |
CREATE INDEX CONCURRENTLY is sorting the output of the index scanning phase. |
| index validation: scanning table |
CREATE INDEX CONCURRENTLY is scanning the table to validate the index tuples collected in the previous two phases. This phase is skipped when not in concurrent mode. Columns blocks_total (set to the total size of the table) and blocks_done contain the progress information for this phase. |
| waiting for old snapshots |
CREATE INDEX CONCURRENTLY or REINDEX CONCURRENTLY is waiting for transactions that can potentially see the table to release their snapshots. This phase is skipped when not in concurrent mode. Columns lockers_total, lockers_done and current_locker_pid contain the progress information for this phase. |
| waiting for readers before marking dead |
REINDEX CONCURRENTLY is waiting for transactions with read locks on the table to finish, before marking the old index dead. This phase is skipped when not in concurrent mode. Columns lockers_total, lockers_done and current_locker_pid contain the progress information for this phase. |
| waiting for readers before dropping |
REINDEX CONCURRENTLY is waiting for transactions with read locks on the table to finish, before dropping the old index. This phase is skipped when not in concurrent mode. Columns lockers_total, lockers_done and current_locker_pid contain the progress information for this phase. |
System Columns
There are several system columns in each table
xmin – This value will be the transaction ID that inserted the row. No transaction ID prior to this value is able to see the row (because it didn’t exist at that point)
xmax – Zero if the row is not deleted, otherwise this value will be the transaction ID that deleted the row. No transaction ID after this value will be able to see the row (because it’s “deleted”!)
cmax and cmin are aliases to the same field (says so in a comment within the Postgresql source) – The command identifier that inserted/deleted the row.
ctid – equivalent to rowid in Oracle, this is a unique, incrementing value for every row in the table. Values are (page, tuple). Running VACUUM FULL will reset the ctid series.
Table Analysis
Operations are planned based on table statistics – out of date statistics can lead to long query times (e.g. Postgresql thinks there are seven rows in a table, but there are actually thirty million rows).
select schemaname, relname, n_mod_since_analyze, last_analyze, last_autoanalyze, analyze_count, autoanalyze_count from pg_stat_all_tables;
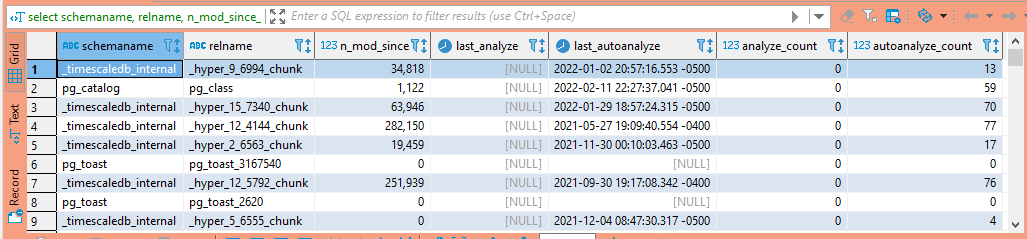
Analysis is usually done as an automatic process, but you can use the ANALYZE command to manually run statistic collection.
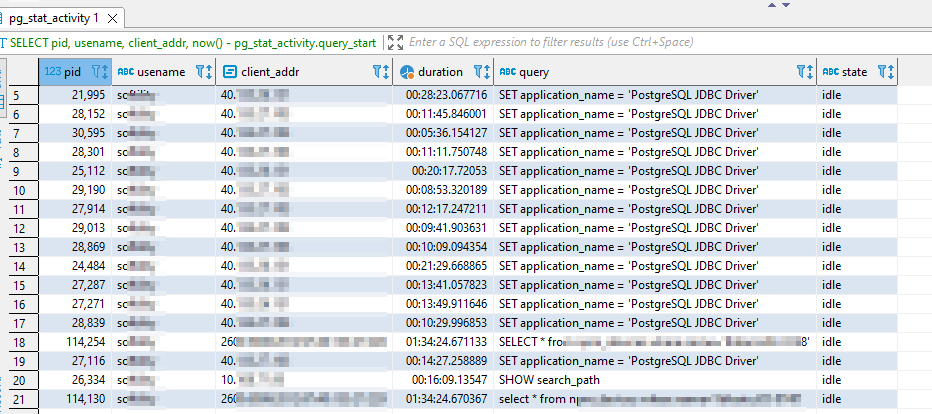
Show all active queries
— active queries
SELECT
pid,
usename,
client_addr,
now() – pg_stat_activity.query_start AS duration,
query,
state
FROM pg_stat_activity
WHERE (now() – pg_stat_activity.query_start) > interval ‘5 minutes’
and state = ‘active’
order by 2 desc;
This query will show all currently active queries (or remark out the “and state = ‘active'” line to return idle connections). This information is useful in identifying long-running queries as well as identifying the PID of a postgres backend that you want to terminate.
Viewing Stats for a Specific Connection
select * from pg_stats_activity where pid = 12345;
If you know the process ID of a backend (e.g. top shows it using a lot of processor), then you can select stats specific to the backend in question using “where pid = <process ID of backend>”.
Terminating A Client Connection
pg_cancel_backend(PID);
— or —
pg_terminate_backend(PID);
When a long-running query is creating problems and cannot be terminated by the initiating user, you can drop the query from the server side. First, you need to identify the PID.
Using pg_cancel_backend sends SIGINT – the ‘nice’ kill. If pg_cancel_backend process does not terminate the query, pg_terminate_backend sends SIGTERM – the do it now kill.Using pg_terminate_backend will probably mean you need to restart postgres.
Reloading The PostgreSQL Configuration
pg_reload_conf();
This command causes the backend processes to reload their configuration – this command sends SIGHUP. The result is Boolean indicates if Postgres was successfully signaled and not that the configuration was successfully reloaded. To determine if any of the postgresql.conf lines were not successfully loaded, use:
SELECT * FROM pg_file_settings WHERE applied IS FALSE;
To determine if any of the pg_hba.conf access entries were not successfully loaded, use:
SELECT * FROM pg_hba_file_rules;
Locks Query
The pg_locks view shows locks from open database transactions — objects may appear more than once in the table if multiple transactions are holding (or waiting on) locks on the object. The “granted” column is a Boolean type – true indicates the row represents a held lock; false indicates the row represents a transaction waiting for a lock. Information from pg_lock is joined to process details from pg_stat_activity.
SELECT
COALESCE(l1.relation::regclass::text,l1.locktype) as locked_item,
w.wait_event_type as waiting_ev_type, w.wait_event as waiting_ev, w.query as waiting_query,
l1.mode as waiting_mode,
(select now() – xact_start as waiting_xact_duration from pg_stat_activity where pid = w.pid),
(select now() – query_start as waiting_query_duration from pg_stat_activity where pid = w.pid),
w.pid as waiting_pid, w.usename as waiting_user, w.state as waiting_state,
l.wait_event_type as locking_ev_type, l.wait_event_type as locking_ev, l.query as locking_query,
l2.mode as locking_mode,
(select now() – xact_start as locking_xact_duration from pg_stat_activity where pid = l.pid),
(select now() – query_start as locking_query_duration from pg_stat_activity where pid = l.pid),
l.pid as locking_pid, l.usename as locking_user, l.state as locking_state
FROM pg_stat_activity w
JOIN pg_locks l1 ON w.pid = l1.pid AND NOT l1.granted
JOIN pg_locks l2 ON (l1.transactionid = l2.transactionid AND l1.pid != l2.pid)
OR (l1.database = l2.database AND l1.relation = l2.relation and l1.pid != l2.pid)
JOIN pg_stat_activity l ON l2.pid = l.pid
WHERE w.wait_event is not null and w.wait_event_type is not null
ORDER BY l.query_start,w.query_start;
Improved Locks Query
Active and pending locks for an object act like a FIFO queue – the first one to request the lock has it until the process is done, the lock is released, then the next guy in line gets the lock. This means that you can have a chain of processes awaiting a single lock. It is, therefore, better to view the locks in this chained fashion – a process that’s sleeping until a lock is released is probably not problematic, you want to investigate the process that’s granted the lock.
— AWESOME locks query (tells you which is root of each lock)
WITH RECURSIVE l AS (
SELECT pid, locktype, mode, granted,
ROW(locktype,database,relation,page,tuple,virtualxid,transactionid,classid,objid,objsubid) obj
FROM pg_locks
), pairs AS (
SELECT w.pid waiter, l.pid locker, l.obj, l.mode
FROM l w
JOIN l ON l.obj IS NOT DISTINCT FROM w.obj AND l.locktype=w.locktype AND NOT l.pid=w.pid AND l.granted
WHERE NOT w.granted
), tree AS (
SELECT l.locker pid, l.locker root, NULL::record obj, NULL AS mode, 0 lvl, locker::text path, array_agg(l.locker) OVER () all_pids
FROM ( SELECT DISTINCT locker FROM pairs l WHERE NOT EXISTS (SELECT 1 FROM pairs WHERE waiter=l.locker) ) l
UNION ALL
SELECT w.waiter pid, tree.root, w.obj, w.mode, tree.lvl+1, tree.path||’.’||w.waiter, all_pids || array_agg(w.waiter) OVER ()
FROM tree JOIN pairs w ON tree.pid=w.locker AND NOT w.waiter = ANY ( all_pids )
)
SELECT (clock_timestamp() – a.xact_start)::interval(3) AS ts_age,
replace(a.state, ‘idle in transaction’, ‘idletx’) state,
(clock_timestamp() – state_change)::interval(3) AS change_age,
a.datname,tree.pid,a.usename,a.client_addr,lvl,
(SELECT count(*) FROM tree p WHERE p.path ~ (‘^’||tree.path) AND NOT p.path=tree.path) blocked,
repeat(‘ .’, lvl)||’ ‘||left(regexp_replace(query, ‘s+’, ‘ ‘, ‘g’),100) query
FROM tree
JOIN pg_stat_activity a USING (pid)
ORDER BY path;
Another query with the same intent:
with recursive activity as (
select
pg_blocking_pids(pid) blocked_by,
*,
age(clock_timestamp(), xact_start)::interval(0) as tx_age,
age(clock_timestamp(), state_change)::interval(0) as state_age
from pg_stat_activity
where state is distinct from ‘idle’
), blockers as (
select
array_agg(distinct c order by c) as pids
from (
select unnest(blocked_by)
from activity
) as dt(c)
), tree as (
select
activity.*,
1 as level,
activity.pid as top_blocker_pid,
array[activity.pid] as path,
array[activity.pid]::int[] as all_blockers_above
from activity, blockers
where
array[pid] <@ blockers.pids
and blocked_by = ‘{}’::int[]
union all
select
activity.*,
tree.level + 1 as level,
tree.top_blocker_pid,
path || array[activity.pid] as path,
tree.all_blockers_above || array_agg(activity.pid) over () as all_blockers_above
from activity, tree
where
not array[activity.pid] <@ tree.all_blockers_above
and activity.blocked_by <> ‘{}’::int[]
and activity.blocked_by <@ tree.all_blockers_above
)
select
pid,
blocked_by,
tx_age,
state_age,
backend_xid as xid,
backend_xmin as xmin,
replace(state, ‘idle in transaction’, ‘idletx’) as state,
datname,
usename,
wait_event_type || ‘:’ || wait_event as wait,
(select count(distinct t1.pid) from tree t1 where array[tree.pid] <@ t1.path and t1.pid <> tree.pid) as blkd,
format(
‘%s %s%s’,
lpad(‘[‘ || pid::text || ‘]’, 7, ‘ ‘),
repeat(‘.’, level – 1) || case when level > 1 then ‘ ‘ end,
left(query, 1000)
) as query
from tree
order by top_blocker_pid, level, pid;
Replication
All of the logical replication subscriptions are accessible in pg_subscription. There is only one copy of pg_subscription per cluster.
select *
from pg_subscription
;
The state of each subscription is accessible in pg_subscription_rel.
select *
from pg_subscription_rel
;
Watching a Query
Instead of terminating a query string with a semi-colon and executing it a single time, you can watch the query. E.G. “\w 30” re-runs the query in 30 second intervals.
select * from sample_table
\w 30
Use CTRL-C to terminate the loop.
View Timescale Continuous Aggregate Stats
Aggregates are summaries of raw data over a period of time – average, max, min value over a defined delta time. Recomputing aggregates whilst ingesting large volumes of data is resource intensive, Continuous aggregates automatically calculate results in the background. The computation is not computed when queried.
select * from timescaledb_information.continuous_aggregate_stats cas ;
Hypertables
Hypertables are visible to users as a single table, but they are actually abstractions of multiple tables (called chunks). This could mean that each device ID (or device type) has its own table, and users are able to query across devices using the hypertable. In Timescale, chunks are partitioned by time intervals. New chunks are automatically as data is inserted into the table. Indexes are built on each chunk independently. Chunks are stored in memory following LRU logic.
To see a listing of the hypertables, run the following query:
select * from information_schema.”tables” t
where table_name like ‘_hypertable_30%’
;
To see metadata about the Timescale hypertables, query timescaledb_information.hypertable. The result set will include the table names, number of chunks the table represents, and nodes to which the hypertable is distributed.
select *
from timescaledb_information.hypertable h
;
View Time Interval For Chunks
To view the time interval stored in each chunk, use the following query:
— see chunk time interval
select h.schema_name, h.table_name
, d.* from “_timescaledb_catalog”.dimension d
join “_timescaledb_catalog”.hypertable h on h.id = d.hypertable_id
;
Hypertable Chunk Information
To view the chunks associated with each hypertable, use the following query:
— chunk -> hypertable map
select c.*
, h.schema_name, h.table_name
from “_timescaledb_catalog”.chunk c
join “_timescaledb_catalog”.hypertable h on h.id = c.hypertable_id
where c.dropped = false
;
To view the chunks associated with a single table:
select * from “_timescaledb_catalog”.chunk
where table_name = ‘_hyper_6_10931_chunk_interface_addl_raw_stats’;
To view the current disk usage for each chunk
select table_schema, table_name, pg_relation_size(‘”‘||table_schema||'”.”‘||table_name||'”‘)
, pg_size_pretty(pg_relation_size(‘”‘ || table_schema || ‘”.”‘ || table_name || ‘”‘) ) table_size_pretty
from information_schema.tables
order by 3 desc
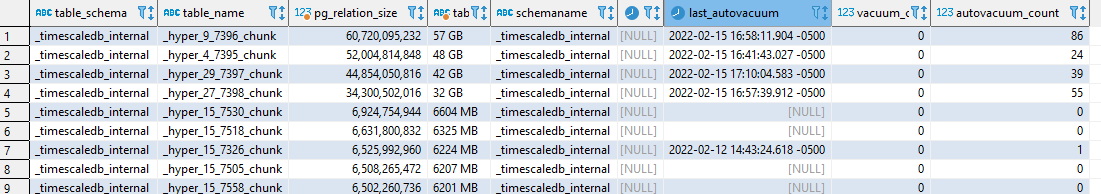
To view the current disk usage for each chunk and display vacuum details for the tables:
select information_schema.tables.table_schema, information_schema.tables.table_name
, pg_relation_size(‘”‘||table_schema||'”.”‘||table_name||'”‘)
, pg_size_pretty(pg_relation_size(‘”‘ || table_schema || ‘”.”‘ || table_name || ‘”‘) ) table_size_pretty
, pg_stat_all_tables.schemaname, pg_stat_all_tables.last_vacuum, pg_stat_all_tables.last_autovacuum, pg_stat_all_tables.vacuum_count, pg_stat_all_tables.autovacuum_count
from information_schema.tables
left outer join pg_stat_all_tables
on information_schema.tables.table_name = pg_stat_all_tables.relname
and information_schema.tables.table_schema = pg_stat_all_tables.schemaname
where pg_stat_all_tables.autovacuum_count is not NULL
— order by pg_stat_all_tables.autovacuum_count desc
order by 3 desc
;
Hypertable Indexes
Indexes are maintained for each chunk. To view the indexes for a chunk (or chunks), query pg_indexes.
select * from pg_indexes
where indexname like ‘_hyper_6_10931_chunk%’;
When an index becomes corrupted, you can reindex the chunk:
–reindex index concurrently “_timescaledb_internal”.”_hyper_6_10931_chunk_interface_addl_raw_stats___TIME_idx”;
Dead Tuples
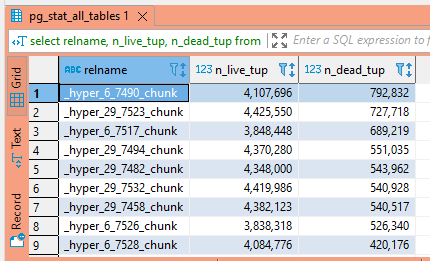
When records are updated or deleted in Postgresql, they aren’t really updated or deleted. In an update operation, the original row is essentially hidden and a new row is created with the updated data. In a deletion operation, the row is essentially hidden. How is a row hidden? Setting the xmax value to the transaction ID performing the UPDATE or DELETE operation. This means data to roll back transactions is available within the table indefinitely … which is great if you find yourself needing to roll back a transaction, but not so great when you’ve got thirty million rows of old data no one cares about. Once the client disconnects, the rows representing deleted data are known as “dead tuples”. Use the following query to get an idea of how many dead tuples are housed within each table.
SELECT relname, n_live_tup, n_dead_tup FROM pg_stat_all_tables ORDER BY n_dead_tup DESC;
If table sizes vary, viewing the ratio of dead to live tuples is more meaningful – having a thousand deleted rows in a table with three rows is (relatively) a lot of wasted space whilst having ten thousand deleted rows in a table of a billion rows is often expected.
SELECT relid, relname,
n_live_tup,
n_dead_tup,
to_char(n_dead_tup/n_live_tup::real, ‘999D99’)::real AS ratio,
pg_size_pretty(pg_relation_size(relid))
FROM pg_stat_all_tables
WHERE pg_relation_size(relid) > 1024 * 1024 AND
n_live_tup > 0
ORDER BY n_dead_tup/n_live_tup::real DESC;
Vacuuming removes these dead tuples, so it’s good to ensure the automatic vacuum has completed recently on any table with a high ratio of dead tuples.
Vacuum Status
select * from pg_stat_progress_vacuum;
When a vacuum is running, the pg_stat_progress_vacuum view will contain progress information. If VACUUM FULL is being run, the progress will instead be reported in pg_stat_progress_cluster, so the from statement can be adjusted accordingly.The following columns are present in the view:
| Column |
Type |
Description |
| pid |
integer |
Process ID of backend. |
| datid |
oid |
OID of the database to which this backend is connected. |
| datname |
name |
Name of the database to which this backend is connected. |
| relid |
oid |
OID of the table being vacuumed. |
| phase |
text |
Current processing phase of vacuum. See Table 27.25. |
| heap_blks_total |
bigint |
Total number of heap blocks in the table. This number is reported as of the beginning of the scan; blocks added later will not be (and need not be) visited by this VACUUM. |
| heap_blks_scanned |
bigint |
Number of heap blocks scanned. Because the visibility map is used to optimize scans, some blocks will be skipped without inspection; skipped blocks are included in this total, so that this number will eventually become equal to heap_blks_total when the vacuum is complete. This counter only advances when the phase is scanning heap. |
| heap_blks_vacuumed |
bigint |
Number of heap blocks vacuumed. Unless the table has no indexes, this counter only advances when the phase is vacuuming heap. Blocks that contain no dead tuples are skipped, so the counter may sometimes skip forward in large increments. |
| index_vacuum_count |
bigint |
Number of completed index vacuum cycles. |
| max_dead_tuples |
bigint |
Number of dead tuples that we can store before needing to perform an index vacuum cycle, based on maintenance_work_mem. |
| num_dead_tuples |
bigint |
Number of dead tuples collected since the last index vacuum cycle. |
To see when a table was last vacuumed, use the following query. Note this query needs to be run against the master in a replicated topology.
select schemaname, relname, last_vacuum, last_autovacuum, vacuum_count, autovacuum_count from pg_stat_all_tables;
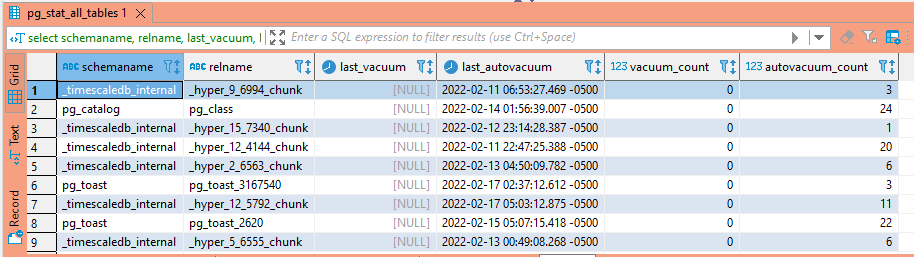
Table Bloat
This is a work in progress as we try to identify why some timescale chunks use much more space than other chunks with similar record counts. This query shows you the wasted bytes within both the table and the index … now we just need to figure out why the bytes are being wasted (because it’s not an inordinate number of dead tuples). In tables with a lot of UPDATE or DELETE operation, bloat can be caused the logic vacuum uses to free disk space to the OS – space is returned to the OS only in the special case where one or more pages at the end of a table become entirely free and an exclusive table lock can be easily obtained. Frequently, vacuum doesn’t actually return space to the OS. It returns space to Postgresql – which makes future insertions more efficient as the file space is already allocated and Postgresql can insert the row without expanding the file. If there is new incoming data, this isn’t a big deal. The “wasted” file space gets used eventually. As an example, create a table with a thousand rows. Check the DB file size, then delete the even rows and wait for autovacuuming to complete. The database file size may not have changed. But if you insert two or three hundred rows, the database file size still won’t change – the new rows have used whitespace within the database file.
But timescale chunks are a little different because new data won’t be coming into the table after some time period – as such, any space that’s available for PG won’t be used. Since we’re not generally performing UPDATE or DELETE operations, the “wasted” space may not be statistically significant.
These queries attempt to estimate how much space the number of records with specific data types should occupy and compare that to the space actually being used.
— https://www.holistics.io/blog/postgresql-queries-usage-monitoring/
with foo as (
SELECT
schemaname, tablename, hdr, ma, bs,
SUM((1-null_frac)*avg_width) AS datawidth,
MAX(null_frac) AS maxfracsum,
hdr+(
SELECT 1+COUNT(*)/8
FROM pg_stats s2
WHERE null_frac<>0 AND s2.schemaname = s.schemaname AND s2.tablename = s.tablename
) AS nullhdr
FROM pg_stats s, (
SELECT
(SELECT current_setting(‘block_size’)::NUMERIC) AS bs,
CASE WHEN SUBSTRING(v,12,3) IN (‘8.0′,’8.1′,’8.2’) THEN 27 ELSE 23 END AS hdr,
CASE WHEN v ~ ‘mingw32′ THEN 8 ELSE 4 END AS ma
FROM (SELECT version() AS v) AS foo
) AS constants
GROUP BY 1,2,3,4,5
), rs as (
SELECT
ma,bs,schemaname,tablename,
(datawidth+(hdr+ma-(CASE WHEN hdr%ma=0 THEN ma ELSE hdr%ma END)))::NUMERIC AS datahdr,
(maxfracsum*(nullhdr+ma-(CASE WHEN nullhdr%ma=0 THEN ma ELSE nullhdr%ma END))) AS nullhdr2
FROM foo
), sml as (
SELECT
schemaname, tablename, cc.reltuples, cc.relpages, bs,
CEIL((cc.reltuples*((datahdr+ma-
(CASE WHEN datahdr%ma=0 THEN ma ELSE datahdr%ma END))+nullhdr2+4))/(bs-20::FLOAT)) AS otta,
COALESCE(c2.relname,’?’) AS iname, COALESCE(c2.reltuples,0) AS ituples, COALESCE(c2.relpages,0) AS ipages,
COALESCE(CEIL((c2.reltuples*(datahdr-12))/(bs-20::FLOAT)),0) AS iotta — very rough approximation, assumes all cols
FROM rs
JOIN pg_class cc ON cc.relname = rs.tablename
JOIN pg_namespace nn ON cc.relnamespace = nn.oid AND nn.nspname = rs.schemaname AND nn.nspname <> ‘information_schema’
LEFT JOIN pg_index i ON indrelid = cc.oid
LEFT JOIN pg_class c2 ON c2.oid = i.indexrelid
)
SELECT
current_database(), schemaname, tablename, /*reltuples::bigint, relpages::bigint, otta,*/
ROUND((CASE WHEN otta=0 THEN 0.0 ELSE sml.relpages::FLOAT/otta END)::NUMERIC,1) AS tbloat,
CASE WHEN relpages < otta THEN 0 ELSE bs*(sml.relpages-otta)::BIGINT END AS wastedbytes,
iname, /*ituples::bigint, ipages::bigint, iotta,*/
ROUND((CASE WHEN iotta=0 OR ipages=0 THEN 0.0 ELSE ipages::FLOAT/iotta END)::NUMERIC,1) AS ibloat,
CASE WHEN ipages < iotta THEN 0 ELSE bs*(ipages-iotta) END AS wastedibytes
FROM sml
ORDER BY wastedbytes DESC
Another iteration:
SELECT
current_database(), schemaname, tablename, reltuples::bigint, relpages::bigint, otta,
ROUND((CASE WHEN otta=0 THEN 0.0 ELSE sml.relpages::float/otta END)::numeric,1) AS tbloat,
CASE WHEN relpages < otta THEN 0 ELSE bs*(sml.relpages-otta)::BIGINT END AS wastedbytes,
iname, ituples::bigint, ipages::bigint, iotta,
ROUND((CASE WHEN iotta=0 OR ipages=0 THEN 0.0 ELSE ipages::float/iotta END)::numeric,1) AS ibloat,
CASE WHEN ipages < iotta THEN 0 ELSE bs*(ipages-iotta) END AS wastedibytes
FROM (
SELECT
schemaname, tablename, cc.reltuples, cc.relpages, bs,
CEIL((cc.reltuples*((datahdr+ma-
(CASE WHEN datahdr%ma=0 THEN ma ELSE datahdr%ma END))+nullhdr2+4))/(bs-20::float)) AS otta,
COALESCE(c2.relname,’?’) AS iname, COALESCE(c2.reltuples,0) AS ituples, COALESCE(c2.relpages,0) AS ipages,
COALESCE(CEIL((c2.reltuples*(datahdr-12))/(bs-20::float)),0) AS iotta — very rough approximation, assumes all cols
FROM (
SELECT
ma,bs,schemaname,tablename,
(datawidth+(hdr+ma-(case when hdr%ma=0 THEN ma ELSE hdr%ma END)))::numeric AS datahdr,
(maxfracsum*(nullhdr+ma-(case when nullhdr%ma=0 THEN ma ELSE nullhdr%ma END))) AS nullhdr2
FROM (
SELECT
schemaname, tablename, hdr, ma, bs,
SUM((1-null_frac)*avg_width) AS datawidth,
MAX(null_frac) AS maxfracsum,
hdr+(
SELECT 1+count(*)/8
FROM pg_stats s2
WHERE null_frac<>0 AND s2.schemaname = s.schemaname AND s2.tablename = s.tablename
) AS nullhdr
FROM pg_stats s, (
SELECT
(SELECT current_setting(‘block_size’)::numeric) AS bs,
CASE WHEN substring(v,12,3) IN (‘8.0′,’8.1′,’8.2’) THEN 27 ELSE 23 END AS hdr,
CASE WHEN v ~ ‘mingw32’ THEN 8 ELSE 4 END AS ma
FROM (SELECT version() AS v) AS foo
) AS constants
GROUP BY 1,2,3,4,5
) AS foo
) AS rs
JOIN pg_class cc ON cc.relname = rs.tablename
JOIN pg_namespace nn ON cc.relnamespace = nn.oid AND nn.nspname = rs.schemaname AND nn.nspname <> ‘information_schema’
LEFT JOIN pg_index i ON indrelid = cc.oid
LEFT JOIN pg_class c2 ON c2.oid = i.indexrelid
) AS sml
ORDER BY wastedbytes desc;
View Enabled and Available Extensions
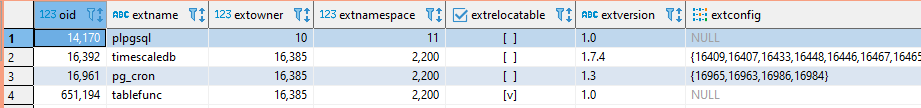
To view the extensions that have been enabled:
SELECT * FROM pg_extension;
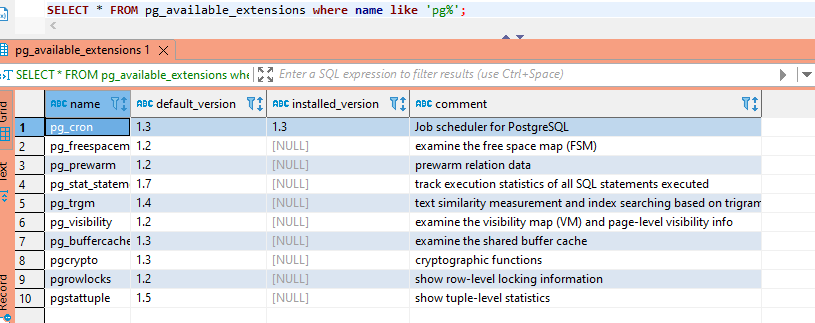
To see what extensions are available:
SELECT * FROM pg_available_extensions;
(add a where clause to limit the returned data – useful when you’re trying to determine if a particular extension is available)
PG_REPACK and PGCOMPACTTABLE
Using VACUUM FULL will create a new table – it requires an exclusive read/write lock on the table for the duration of the operation, thus negatively impacts table availability. There are two alternatives to a full vacuum that can reclaim wasted space without limiting access to the table.
pg_repack essentially performs the following operations:
BEGIN;
CREATE TABLE new_table AS SELECT * FROM old_table;
ALTER TABLE old_table RENAME TO old_bloated;
ALTER TABLE new_table RENAME TO old_table;
DROP TABLE old_bloated;
COMMIT;
Any indexes that existed in the original table will be created on the new one. There’s actually a trigger that queues any changes made to the table during the repack operation to be replayed into the new_table just before the tables are switched. A table that is recreated using VACUUM FULL should have zero dead tuples, but a repacked table may have some (some update or delete operations are performed during the repack). Running pg_repack is resource intensive, so it can diminish performance on your database server. It can also increase replication lag.
PG_REPACK is an extension, so it needs to be created in the database:
CREATE EXTENSION pg_repack;
Then pg_repack needs to be launched from the command line:
pg_repack -t “tablename” -U dbusername dbname
pgcompacttable also performs online maintenance, but does so in place. This requires fewer resources, but the compaction process is much slower. On a small table, that may not be a concern. On a very large table, it may not be practical to use pgcompacttable.
Misc Unsorted Info
select max(“__TIME”) from components.interface_addl_raw_stats iadso;
–insert into components.interface_addl_raw_stats_old
–select * from components.interface_addl_raw_stats
–where “__TIME” between ‘2022-02-02 21:08:22’::timestamp and ‘2022-02-03 00:00:00’::timestamp
–on conflict do nothing
–;
–alter view components.interface_day_stats rename to interface_day_stats_new;
–alter view components.interface_day_stats_old rename to interface_day_stats;
–alter view components.interface_hour_stats rename to interface_hour_stats_new;
–alter view components.interface_hour_stats_old rename to interface_hour_stats;
–alter view components.interface_addl_day_stats rename to interface_addl_day_stats_new;
–alter view components.interface_addl_day_stats_old rename to interface_addl_day_stats;
–alter view components.interface_addl_hour_stats rename to interface_addl_hour_stats_new;
–alter view components.interface_addl_hour_stats_old rename to interface_addl_hour_stats;
–alter table components.interface_raw_stats rename to interface_raw_stats_new;
–alter table components.interface_raw_stats_old rename to interface_raw_stats;
–alter table components.interface_addl_raw_stats rename to interface_addl_raw_stats_new;
–alter table components.interface_addl_raw_stats_old rename to interface_addl_raw_stats;