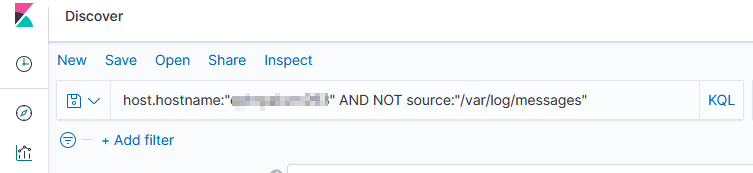
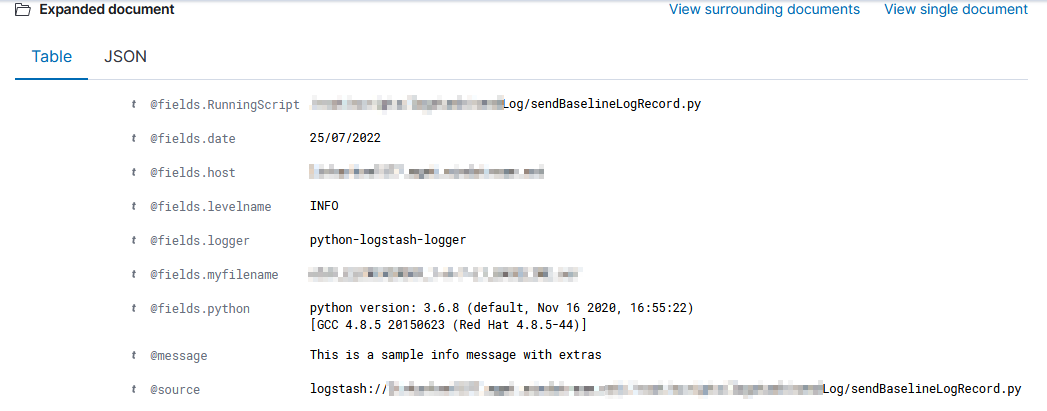
I’ve been working on forking log data into two different indices based on an element contained within the record — if the filename being sent includes the string “BASELINE”, then the data goes into the baseline index, otherwise it goes into the scan index. The data being ingested has the file name in “@fields.myfilename”
It took a while to figure out how to get the value from the current data — event.get(‘[@fields][myfilename]’) to get the @fields.myfilename value.
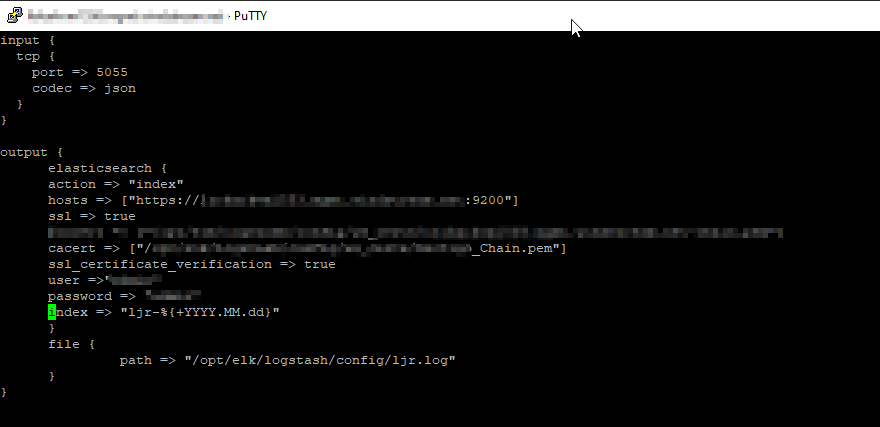
The following logstash config accepts JSON inputs, parses the underscore-delimited filename into fields, replaces the dashes with underscores as KDL doesn’t handle dashes and wildcards in searches, and adds a flag to any record that should be a baseline. In the output section, that flag is then used to publish data to the appropriate index based on the baseline flag value.
input {
  tcp {
    port => 5055
    codec => json
  }
}
filter {
        # Sample file name: scan_ABCDMIIWO0Y_1-A-5-L2_BASELINE.json
        ruby {  code => "
                        strfilename = event.get('[@fields][myfilename]')
                        arrayfilebreakout = strfilename.split('_')
                        event.set('hostname', arrayfilebreakout[1])
                        event.set('direction',arrayfilebreakout[2])
                        event.set('parseablehost', strfilename.gsub('-','_'))

                        if strfilename.downcase =~ /baseline/
                                event.set('baseline', 1)
                        end" }
}
output {
        if [baseline] == 1 {
                elasticsearch {
                        action => "index"
                        hosts => ["https://elastic.example.com:9200"]
                        ssl => true
                        cacert => ["/path/to/logstash/config/certs/My_Chain.pem"]
                        ssl_certificate_verification => true
                        # Credentials go here
                        index => "ljr-baselines"
                }
        }
        else{
              elasticsearch {
                        action => "index"
                        hosts => ["https://elastic.example.com:9200"]
                        ssl => true
                        cacert => ["/path/to/logstash/config/certs/My_Chain.pem"]
                        ssl_certificate_verification => true
                        # Credentials go here
                        index => "ljr-scans-%{+YYYY.MM.dd}"
                }
        }
}