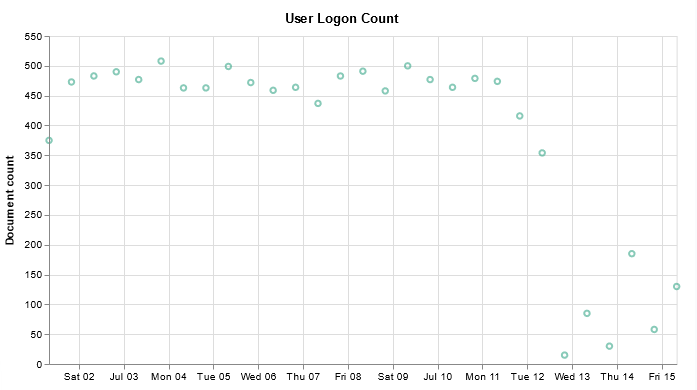
I have finally managed to produce a chart that includes a query — I don’t want to have to walk all of the help desk users through setting up the query, although I figured having the ability to select your own time range would be useful.
{
  $schema: https://vega.github.io/schema/vega-lite/v2.json
  title: User Logon Count

  // Define the data source
  data: {
    url: {
      // Which index to search
      index: firewall_logs*

      body: {
        _source: ['@timestamp', 'user', 'action']

"query": {
	"bool": {
		"must": [{
				"query_string": {
					"default_field": "subtype",
					"query": "user"
				}
			},
	   {
				"range": {
					"@timestamp": {
						"%timefilter%": true
                    			}
                  		}
     	}]
	}
}


        aggs: {
          time_buckets: {
            date_histogram: {
              field: @timestamp
              interval: {%autointerval%: true}
              extended_bounds: {
                // Use the current time range's start and end
                min: {%timefilter%: "min"}
                max: {%timefilter%: "max"}
              }
              // Use this for linear (e.g. line, area) graphs.  Without it, empty buckets will not show up
              min_doc_count: 0
            }
          }
        }
        size: 0
      }
    }
    format: {property: "aggregations.time_buckets.buckets"}
  }
  mark: point
  encoding: {
    x: {
      field: key
      type: temporal
      axis: {title: false} // Don't add title to x-axis
    }
    y: {
      field: doc_count
      type: quantitative
      axis: {title: "Document count"}
    }
  }
}