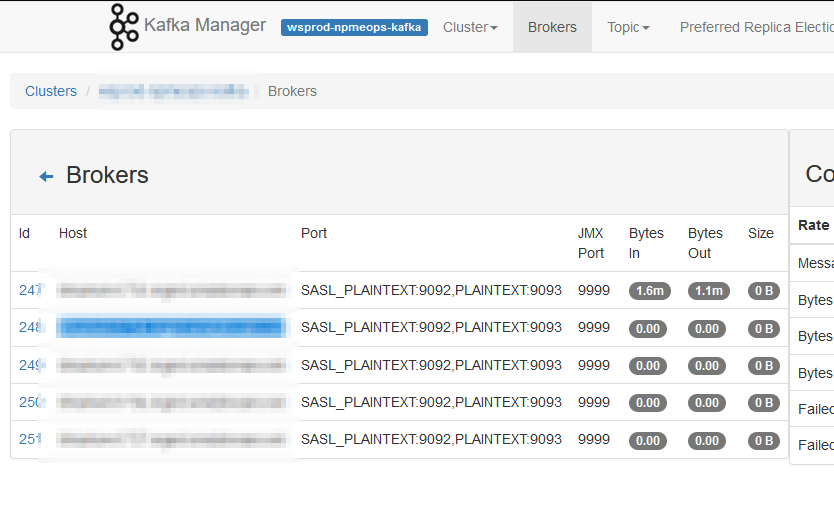
I set up a few topics for a new process, but the client was continually unable to subscribe getting the following messages:
[2023-01-06 12:54:58,965] INFO [Worker clientId=connect-1, groupId=connect-cluster-group-dev] Group coordinator kafkahost.example.com:9092 (id: 2147483415 rack: null) is unavailable or invalid due to cause: error response NOT_COORDINATOR.isDisconnected: false. Rediscovery will be attempted. (org.apache.kafka.clients.consumer.internals.AbstractCoordinator:904)
[2023-01-06 12:54:58,966] INFO [Worker clientId=connect-1, groupId=connect-cluster-group-dev] JoinGroup failed: This is not the correct coordinator. Marking coordinator unknown. Sent generation was Generation{generationId=-1, memberId='', protocol='null'} (org.apache.kafka.clients.consumer.internals.AbstractCoordinator:623)
[2023-01-06 12:54:58,966] INFO [Worker clientId=connect-1, groupId=connect-cluster-group-dev] Rebalance failed. (org.apache.kafka.clients.consumer.internals.AbstractCoordinator:472)
org.apache.kafka.common.errors.NotCoordinatorException: This is not the correct coordinator.
The output should contain your topic and an offset:
kafkasandbox:bin # ./kafka-console-consumer.sh  --bootstrap-server kafkaserver.example.com:9092 --formatter "kafka.coordinator.group.GroupMetadataManager\$OffsetsMessageFormatter" --topic __consumer_offsets
[APP_RUN,appa_DB_error,5]::OffsetAndMetadata(offset=912219, leaderEpoch=Optional.empty, metadata=, commitTimestamp=1673378016876, expireTimestamp=None)
[APP_RUN,appb_DB_error,5]::OffsetAndMetadata(offset=424539, leaderEpoch=Optional.empty, metadata=, commitTimestamp=1673378016938, expireTimestamp=None)
[APP_RUN,appb_DB_error,3]::OffsetAndMetadata(offset=359340, leaderEpoch=Optional.empty, metadata=, commitTimestamp=1673378016938, expireTimestamp=None)
[APP_RUN,appc_DB_error,2]::OffsetAndMetadata(offset=986361, leaderEpoch=Optional.empty, metadata=, commitTimestamp=1673378017005, expireTimestamp=None)
I recreated the topics with the replication factor equal to the number of servers. I restarted all of the Kafka and ZooKeeper services. We tried from other clients. We tried searching the internet for some pointer as to what has gone awry. The only thing I could find is that the __consumer_offsets topic wasn’t right … you should be able to read the offset data:
/kafka-console-consumer.sh --bootstrap-server kafkahost.example.net:9092 --formatter "kafka.coordinator.group.GroupMetadataManager\$OffsetsMessageFormatter" --topic __consumer_offsets
Now, resetting the entire consumer offsets partition is a massively bad idea in a production environment. We’ve had to advance offsets before, but never had to reset the entire partition.
The documentation I found online used a ZooKeeper command that no longer exists — ‘rmr’ — but deleteall (basically a subtree deletion) did the trick.
# Reset consumer offsets
# Note -- this is a *really* bad idea in production as it can lead to missed messages. You should record the current offsets, clear the topic, then set the offset for the client groups
systemctl stop kafka # on all servers
mv /kafka/ws_npm_kafka/data-kafka/__consumer_offsets-* /tmp/
./zookeeper-shell.sh localhost:2181
deleteall /brokers/topics/__consumer_offsets
# Once this has been done on all servers, restart kafka
systemctl start kafka