Walking by the river to collect our maple sap

Walking by the river to collect our maple sap
That didn’t take long! The peach blossoms are opening.

The new peach trees have flower buds — the nursery said the potted trees can fruit the first year (but trim buds on any of the bare root plants since they need to establish their root system!). We might get to taste some peaches this year!

While we were swapping out sap buckets today, Anya noticed our first daffodils in bloom!


This is the year we fill the orchard! The plants have started arriving, and hopefully we will be able to get them in the ground this weekend (not looking good, so it will probably be next weekend)
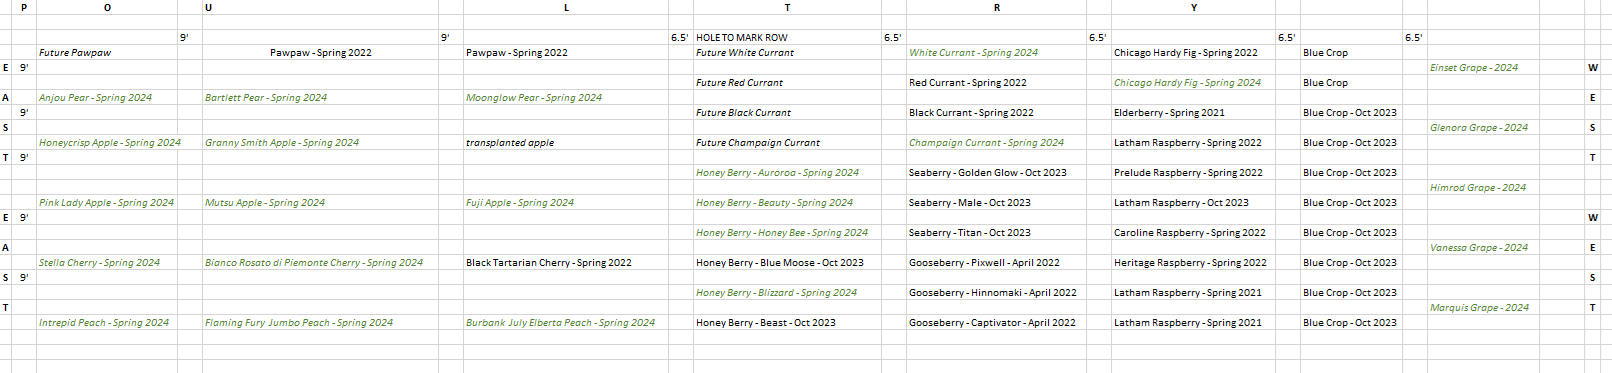
I’ve also got plums, northern almonds, and northern pecans to plant in the pasture area. We’re excited to see what pecans and almonds that can survive USDA Growing Zone 6 taste like!
We’ve been working to lock down our workstations … not “so secure you cannot use it”, but just this side of the functional/nonfunctional line. Everything went surprisingly well except I use the Office 365 suite for work. Periodically, it has to “phone home” and verify my work account is still valid. And that didn’t seem to go through the proxy well. The authentication screen would pop up and immediately throw an error:
No internet connection. Please check your network settings and try again [2604]
I spent a whole bunch of time playing around with the firewall rules, the proxy rules … and finally went so far as to just turn off the firewall and remove the proxy. And it still didn’t work. Which was nice because it means I didn’t break it … but also meant it was going to be a lot harder to fix!
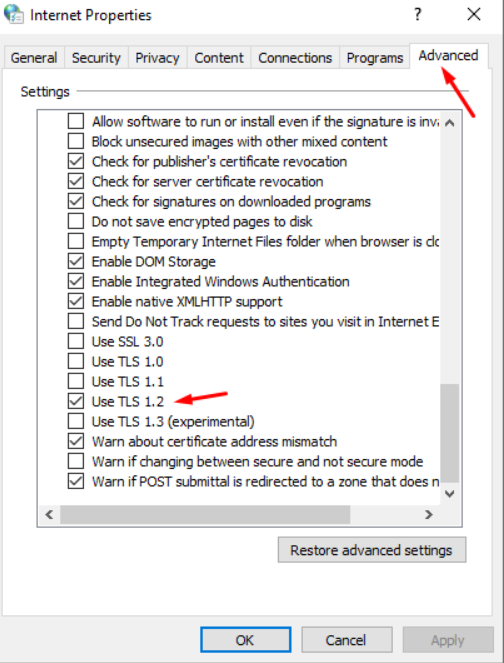
Finally found the culprit — a new Windows installation, for some reason, uses really old SSL/TLS versions. Turned on 1.2 and, voila, I’ve got a sign-on screen. Sigh! Turned the firewall & proxy back on, and everything works beautifully. I think I’m going to add these settings to the domain policy so I don’t have to configure this silliness every time.
I’m playing around with blocking all outbound connections on our computers and run most traffic through a proxy … Skype, however, won’t make voice/video calls with the HTTPS proxy set. We had to add a lot of subnets to the ruleset before the called party would get a ring. But it finally worked. This is the NFT ruleset, but I’ve got the same subnets added to the Windows Firewall too.
table inet filter {
        chain WIFI-FILTERONLYLOCAL {
                type filter hook output priority filter; policy accept;
                ip protocol tcp ip daddr 10.0.0.0/8 accept
                ip protocol udp ip daddr 10.0.0.0/8 accept
                ip protocol tcp ip daddr 13.64.0.0/11 accept
                ip protocol tcp ip daddr 13.96.0.0/13 accept
                ip protocol tcp ip daddr 13.104.0.0/14 accept
                ip protocol tcp ip daddr 13.107.0.0/16 accept
                ip protocol tcp ip daddr 13.107.6.171/32 accept
                ip protocol tcp ip daddr 13.107.18.15/32 accept
                ip protocol tcp ip daddr 13.107.140.6/32 accept
                ip protocol tcp ip daddr 20.20.32.0/19 accept
                ip protocol tcp ip daddr 20.180.0.0/14 accept
                ip protocol tcp ip daddr 20.184.0.0/13 accept
                ip protocol tcp ip daddr 20.190.128.0/18 accept
                ip protocol tcp ip daddr 20.192.0.0/10 accept
                ip protocol tcp ip daddr 20.202.0.0/16 accept
                ip protocol udp ip daddr 20.202.0.0/16 accept
                ip protocol tcp ip daddr 20.231.128.0/19 accept
                ip protocol tcp ip daddr 40.126.0.0/18 accept
                ip protocol tcp ip daddr 51.105.0.0/16 accept
                ip protocol tcp ip daddr 51.116.0.0/16 accept
                ip protocol tcp ip daddr 52.108.0.0/14 accept
                ip protocol tcp ip daddr 52.112.0.0/14 accept
                ip protocol tcp ip daddr 52.138.0.0/16 accept
                ip protocol udp ip daddr 52.138.0.0/16 accept
                ip protocol tcp ip daddr 52.145.0.0/16 accept
                ip protocol tcp ip daddr 52.146.0.0/15 accept
                ip protocol tcp ip daddr 52.148.0.0/14 accept
                ip protocol tcp ip daddr 52.152.0.0/13 accept
                ip protocol tcp ip daddr 52.160.0.0/11 accept
                ip protocol tcp ip daddr 52.244.37.168/32 accept
                ip protocol tcp ip daddr 138.91.0.0/16 accept
                ip protocol udp ip daddr 138.91.0.0/16 accept
                ip protocol icmp accept
                ip protocol udp ct state { established, related } accept
                limit rate over 1/second log prefix "FILTERONLYLOCAL: "
                drop
        }
}
Since “they” said the first egg was no longer viable on the 7th of March, we wondered when the rest of the eggs would be non-viable … looks like this weekend and Tuesday. Bummer, because we were hoping to see some baby eagles! Ash gets transfixed when there’s a bird on the TV.
| Egg | Egg Laid | Hatch Date | Nonviable Date |
| 1st | 26 Jan 2024 | 1 Mar 2024 | 7 Mar 2024 |
| 2nd | 28 Jan 2024 | 3 Mar 2024 | 9 Mar 2024 |
| 3rd | 31 Jan 2024 | 6 Mar 2024 | 12 Mar 2024 |
I got a rather last minute notice from our security department that the SSL certificate used in the IdP partnership between my application and their identity provider would be expiring soon and did I want to renew it Monday, Tuesday, or Wednesday. Being that this was Friday afternoon … “none of the above” would have been my preference to avoid filing the “emergency change” paperwork, but Wednesday was the least bad of the three options. Of course, an emergency requires paperwork as to why you didn’t plan two weeks in advance. And how you’ll do better next time.
Sometimes that is a bit of a stretch — next time someone is working on the electrical system and drops a half-inch metal plate into the building wiring, I’m probably still going to have a problem when the power drops. But, in this case, there are two perfectly rational solutions. One, of course, would be that the people planning the certificate renewals start contacting partner applications more promptly. But that’s not within my purview. The thing I can do is watch the metadata on the identity provider and tell myself when the certificates will be expiring soon.
So I now have a little python script that has a list of all of our SAML-authenticated applications. It pulls the metadata from PingID, loads the X509 certificate, checks how far in the future the expiry date is. In my production version, anything < 30 days sends an e-mail alert. Next time, we can contact security ahead of time, find out when they’re planning on doing the renewal, and get the change request approved well in advance.
import requests
import xml.etree.ElementTree as ET
from cryptography import x509
from cryptography.hazmat.backends import default_backend
from datetime import datetime, date

strIDPMetadataURLBase = 'https://login.example.com/pf/federation_metadata.ping?PartnerSpId='
listSPIDs = ["https://tableau.example.com", "https://email.example.com", "https://internal.example.com", "https://salestool.example.com"]

for strSPID in listSPIDs:
    objResults = requests.get(f"{strIDPMetadataURLBase}{strSPID}")
    if objResults.status_code == 200:
        try:
            root = ET.fromstring(objResults.text)

            for objX509Cert in root.findall("./{urn:oasis:names:tc:SAML:2.0:metadata}IDPSSODescriptor/{urn:oasis:names:tc:SAML:2.0:metadata}KeyDescriptor/{http://www.w3.org/2000/09/xmldsig#}KeyInfo/{http://www.w3.org/2000/09/xmldsig#}X509Data/{http://www.w3.org/2000/09/xmldsig#}X509Certificate"):
                strX509Cert = f"-----BEGIN CERTIFICATE-----\n{objX509Cert.text}\n-----END CERTIFICATE-----"

                cert = x509.load_pem_x509_certificate(bytes(strX509Cert,'utf8'), default_backend())
                iDaysUntilExpiry = cert.not_valid_after - datetime.today()
                print(f"{strSPID}\t{iDaysUntilExpiry.days}")
        except:
            print(f"{strSPID}\tFailed to decode X509 Certficate")
    else:
        print(f"{strSPID}\tFailed to retrieve metadata XML")
We finished our first batch of maple syrup — about 3.25 gallons completed boiling last night and have been bottled and sealed today.