What is ElasticSearch?
ElasticSearch, based on the Lucene search software, is a distributed search and analytics application which ingests, stores, and indexes data. Kibana is a web-based front-end providing user access to data stored within ElasticSearch.
What is OpenSearch?
In short, it’s the same but different. OpenSearch is also based on the Lucene search software, is designed to be a distributed search and analytics application, and ingests/stores/indexes data. If it’s essentially the same thing, why does OpenSearch exist? ElasticSearch was initially licensed under the open-source Apache 2.0 license – a rather permissive free software license. ElasticCo did not agree with how their software was being used by Amazon; and, in 2021, the license for ElasticSearch was changed to Server Side Public License (SSPL). One of the requirements of SSPL is that anyone who implements the software and sells their implementation as a service needs to publish their source code under the SSPL license – not just changes made to the original program but all other software a user would require to run the software-as-a-service environment for themselves. Amazon used ElasticSearch for their Amazon Elasticsearch Service offering, but was unable/unwilling to continue doing so under the new license terms. In April of 2021, Amazon Web Services created a fork of ElasticSearch as the basis for OpenSearch.
Differences Between OpenSearch and ElasticSearch
After the OpenSearch fork was created, the product roadmap for ElasticSearch was driven by ElasticCo and the roadmap for OpenSearch was community driven (with significant oversight and input from Amazon) – this means the products are not identical although they provide the same core functionality. Elastic publishes a list of features unique to ElasticSearch, and the underlying machine learning algorithms are different. However, the important components of the “unique” feature list have been implemented in OpenSearch over time.
The biggest differences are price and support. OpenSearch is free software – there is no purchasing a license to unlock features. It does appear that Amazon has an internal iteration of OpenSearch as their as-a-service offering provides features not available in the open-source OpenSearch code base, but that is only available for cloud customers. ElasticCo offers ElasticSearch as free software with a limited feature set. One critical limitation is user authentication mechanisms – we are unable to implement PingID as an authentication source with the free feature set. Advanced features not currently used today – machine learning based anomaly detection, as an example – are also unavailable in the free iteration of ElasticSearch. With an ElasticSearch license, we would also get vendor support. OpenSearch does not offer vendor support, although there are third party companies that will provide support services.
Both OpenSearch and ElasticSearch have community-based support forums available – I have gotten responses from developers on both forums for questions regarding usage nuances.
Salient Feature Comparison
Most companies have a list differentiating their product from the products offered by competitors – but the important thing is how the products differ as it relates to how an individual customer uses the product. A car that can have a fresh cup of espresso waiting for you as you leave for work might be amazing to some people, but those who don’t drink coffee won’t be nearly as impressed. So how do the two products compare for me?
Data ingestion – Data is ingested using the same mechanisms – ElasticCo’s filebeat and logstash are important components of data ingestion, and these components remain unchanged. This means existing processes that feed data into ElasticSearch today would not need to be changed to begin ingesting data into OpenSearch.
Data storage – Both products distribute searchable data over a cluster of servers. Data storage is “tiered” as hot, warm, and cold which allows less used data to reside on slower, less expensive resources. We have confirmed that ingested data is properly housed on cluster nodes designated for ‘hot’ storage and moved to ‘warm’ and ‘cold’ storage as dictated by defined policies. The item count to size ratio is similar between both products (i.e. storing ten million documents takes about the same amount of disk space). OpenSearch provides the ability to alert on transition failures (moving from hot to warm, for instance) which will reduce the amount of manual “health checking” required for the environment.
Search and aggregation – Both products allow both GUI and API searches of indexed data. Data can be aggregated as it is searched – returning the max/min/average value from a search, a count of records matching search criterion, creating sub-aggregations. ElasticSearch does have aggregations not available in OpenSearch, although these could be handled through custom scripted aggregations and many have corresponding GitHub issues requesting such an aggregation be added to OpenSearch (e.g. weighted average, geohash grid, or geotile grid)
| auto-interval date histogram | x | |
| categorize text | x | |
| children | x | |
| composite | x | |
| frequent items | x | |
| geohex grid | x | |
| geotile grid | x | |
| ip prefix | x | |
| multi terms | x | |
| parent | x | |
| random sampler | x | |
| rare terms | x | |
| terms | x | |
| variable width histogram | x | |
| boxplot | x | |
| geo-centroid | x | |
| geo-line | x | |
| median absolute deviation | x | |
| rate | x | |
| string stats | x | |
| t-test | x | |
| top metrics | x | |
| weighted avg | x |
Alerting – ElastAlert2 can be used to provide the same index monitoring and alerting functionality that ElastAlert currently provides with ElasticSearch. Additionally, OpenSearch includes a built-in alerting capability that might allow us to streamline the functionality into the base OpenSearch implementation.
API Access – Both ElasticSearch and OpenSearch provide API-based access to data. Queries to the ElasticSearch API endpoint returned expected data when directed to the OpenSearch API endpoint. The ElasticSearch python module can be used to access OpenSearch data, although there is a specific OpenSearch module as well.
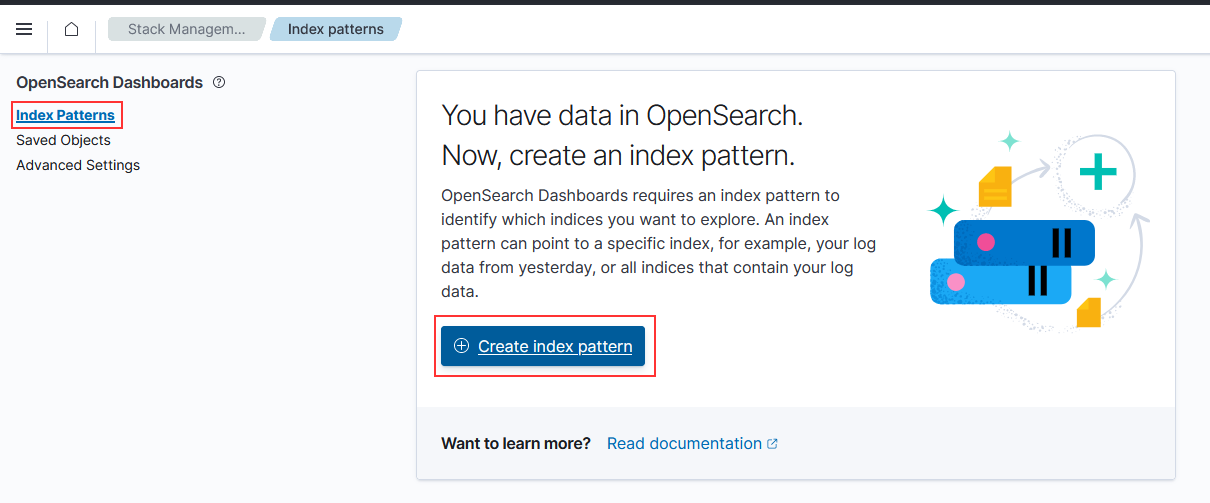
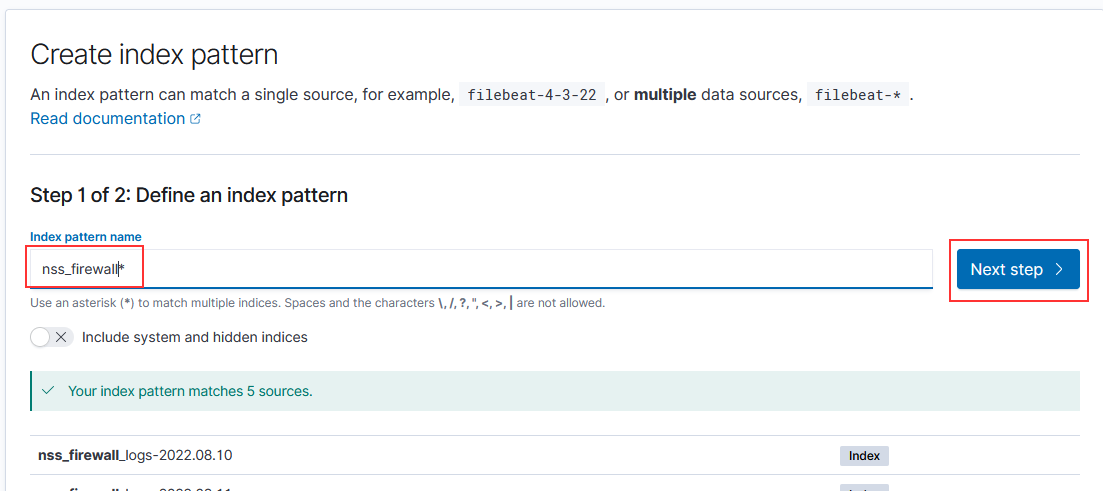
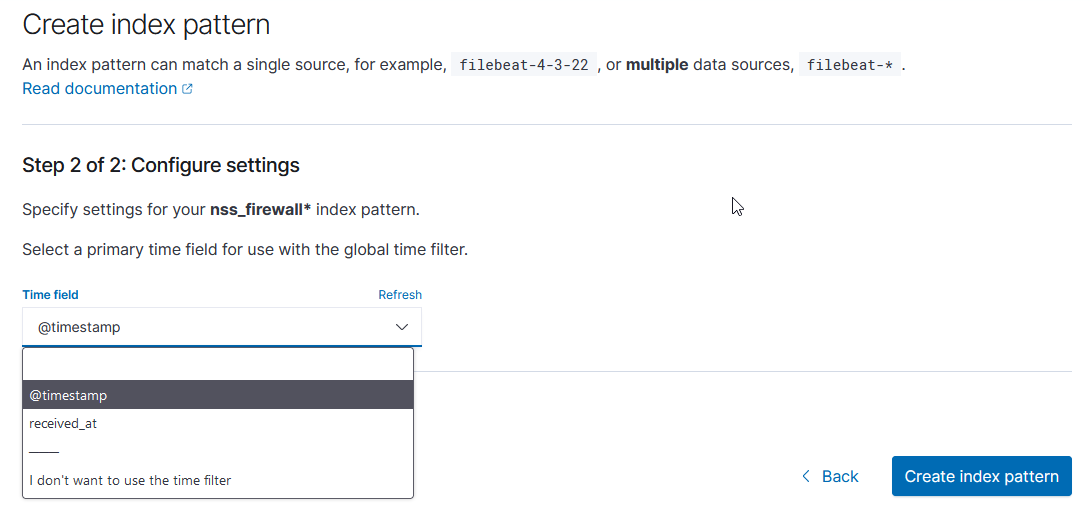
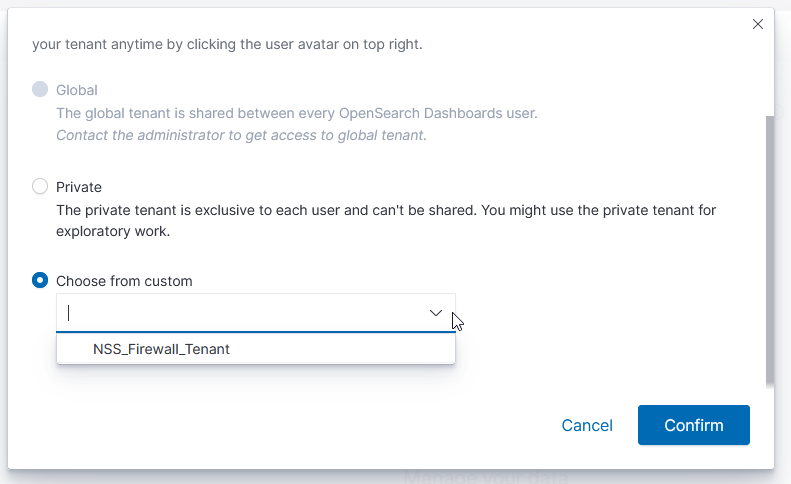
UX – ElasticSearch allows users to search and visualize data through Kibana; OpenSearch provides graphical user access in OpenSearch Dashboard. While the “look and feel” of the GUI differs (Kibana 8 looks different than the Kibana 7 we use today, too), the user functionality remains the same.
| Kibana 7.7 | OpenSearch Dashboards 2.2 |
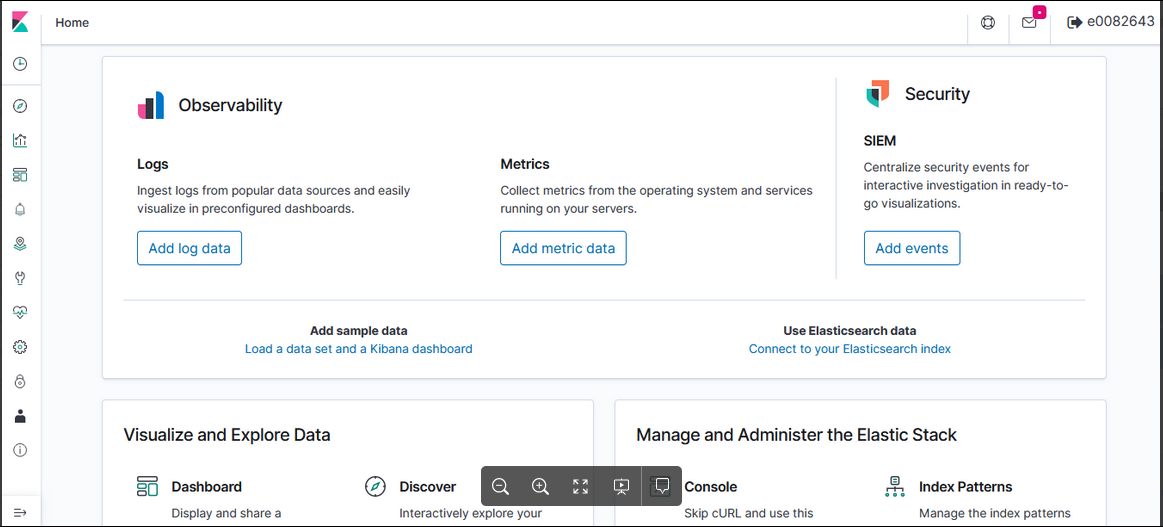 | 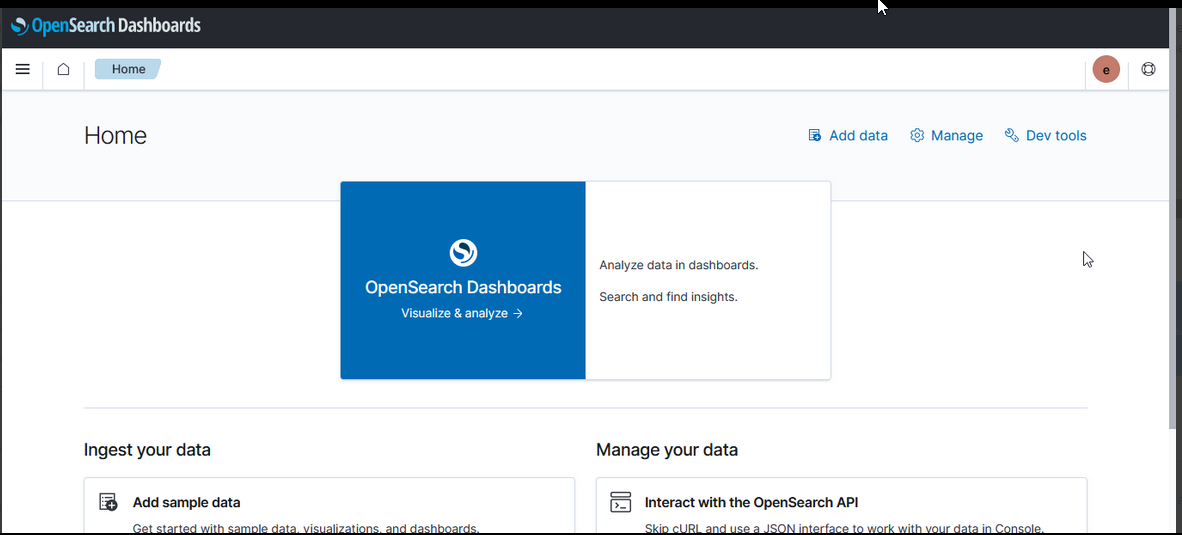 |
Kibana uses “KQL” – Kibana Query Language – to compose searches while OpenSearch Dashboards uses “DQL” – Dashboards Query Language, but queries used in Kibana were used in OpenSearch Dashboard without modification.
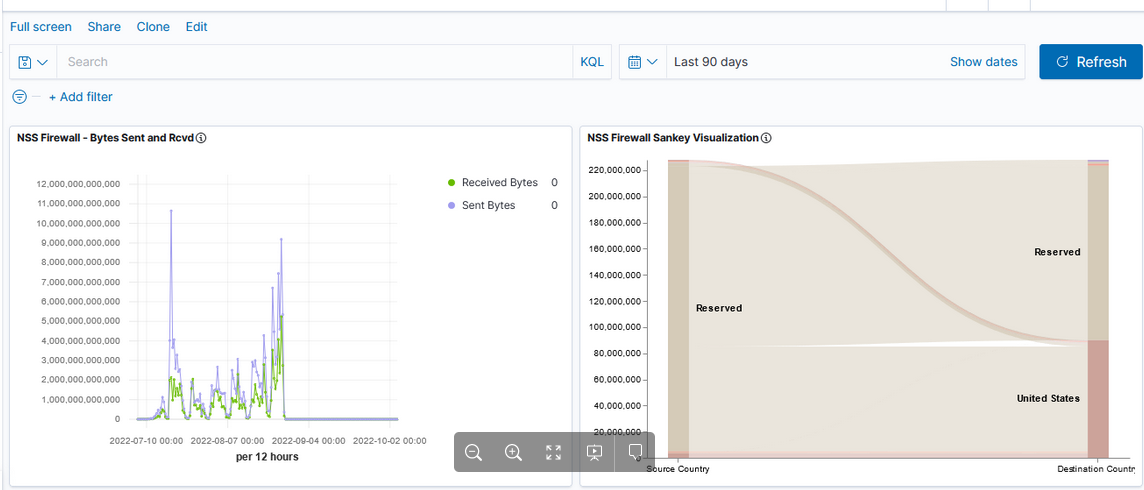
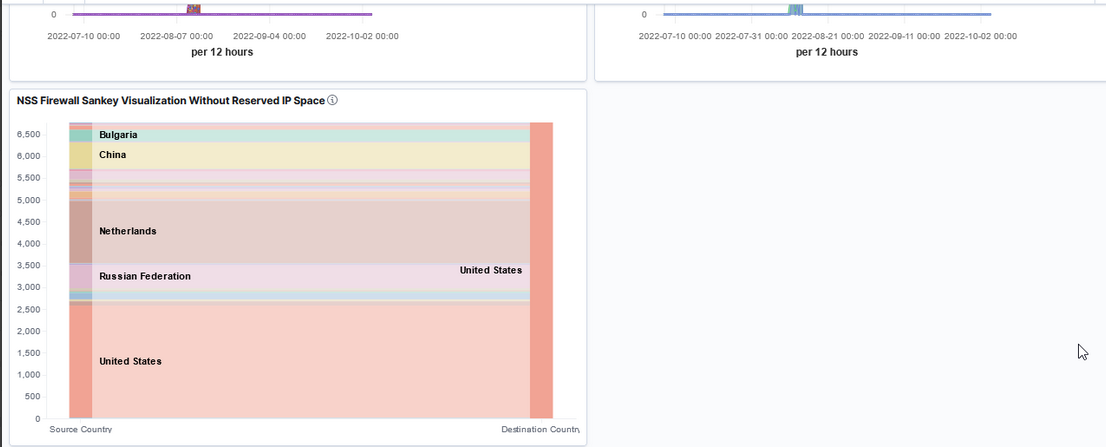
Currently used visualizations are available in both Kibana and OpenSearch Dashboards
| Kibana Visualization | OpenSearch Dashboards Visualization |
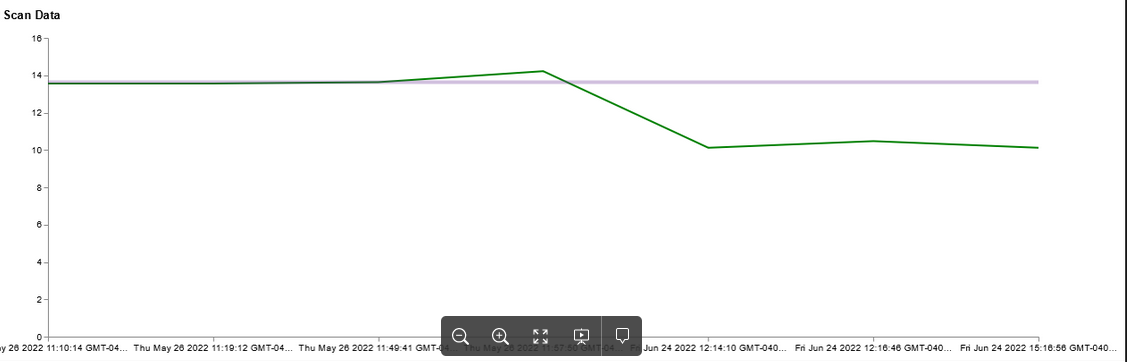 | 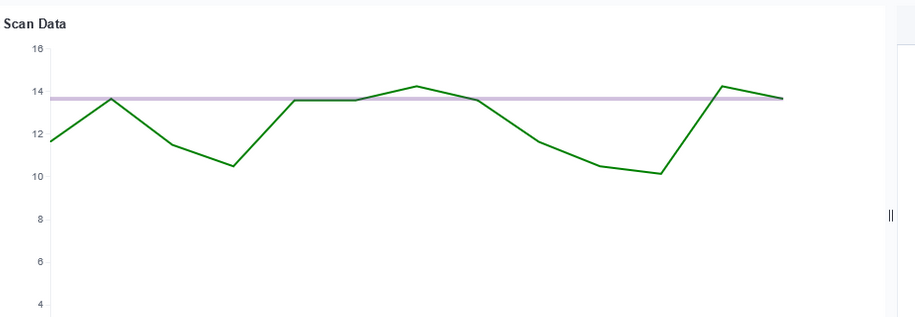 |
But there are some currently unused visualizations that are unique to each product.
| Area | x | x |
| Controls | x | x |
| Data Table | x | x |
| Gauge | x | x |
| Goal | x | x |
| Heat Map | x | x |
| Horizonal Bar | x | x |
| Lens | x | |
| Line | x | x |
| Maps | x | |
| Markdown | x | x |
| Metric | x | x |
| Pie | x | x |
| Tag Cloud | x | x |
| Timeline | x | x |
| TSVB | x | x |
| Vega | x | x |
| Vertical Bar | x | x |
| Coordinate Map | x | |
| Gantt Chart | x | |
| Region Map | x |
Dashboards can be used to group visualizations.
| Kibana | OpenSearch Dashboards |
 |  |
New features will be available in either OpenSearch or a licensed installation of ElasticSearch. Currently data is either retained as written or aged out of the system to save disk space. Either path allows us to roll up data – as an example retaining the total number of users per month or total bytes per month instead of retaining each detailed record. Additionally, we will be able to use the “anomaly detection” which is able to monitor large volumes of index data and highlight unusual events. Both newer ElasticSearch versions and OpenSearch offer a Tableau connector which may make data stored in the platform more accessible to users.