Trying to upgrade our dev Kubernetes environment to 1.24.12 … and we encountered what seems to be a fairly common error — unknown service runtime.v1alpha2.RuntimeService
kubeserver:~ # kubeadm init
I0323 13:53:26.492921   55320 version.go:256] remote version is much newer: v1.26.3; falling back to: stable-1.24
[init] Using Kubernetes version: v1.24.12
[preflight] Running pre-flight checks
        [WARNING Firewalld]: firewalld is active, please ensure ports [6443 10250] are open or your cluster may not function correctly
error execution phase preflight: [preflight] Some fatal errors occurred:
        [ERROR FileAvailable--etc-kubernetes-manifests-kube-apiserver.yaml]: /etc/kubernetes/manifests/kube-apiserver.yaml already exists
        [ERROR FileAvailable--etc-kubernetes-manifests-kube-controller-manager.yaml]: /etc/kubernetes/manifests/kube-controller-manager.yaml already exists
        [ERROR FileAvailable--etc-kubernetes-manifests-kube-scheduler.yaml]: /etc/kubernetes/manifests/kube-scheduler.yaml already exists
        [ERROR FileAvailable--etc-kubernetes-manifests-etcd.yaml]: /etc/kubernetes/manifests/etcd.yaml already exists
        [ERROR CRI]: container runtime is not running: output: E0323 13:53:26.741684   55340 remote_runtime.go:948] "Status from runtime service failed" err="rpc error: code = Unimplemented desc = unknown service runtime.v1alpha2.RuntimeService"
time="2023-03-23T13:53:26-05:00" level=fatal msg="getting status of runtime: rpc error: code = Unimplemented desc = unknown service runtime.v1alpha2.RuntimeService"
, error: exit status 1
        [ERROR DirAvailable--var-lib-etcd]: /var/lib/etcd is not empty
[preflight] If you know what you are doing, you can make a check non-fatal with `--ignore-preflight-errors=...`
To see the stack trace of this error execute with --v=5 or higher
We found a lot of people online with the same issue who (1) removed the config.toml and tried again, (2) changed the SystemdCGroup setting in the config, or uninstalled and reinstalled some/all of the components until it worked. Unfortunately, removing or modifying the config didn’t help. And removing and reinstalling everything wasn’t particularly appealing. However, we noticed that the same error was reported directly from containerd:
kubeserver:~ # crictl ps
E0323 13:53:07.061777   55228 remote_runtime.go:557] "ListContainers with filter from runtime service failed" err="rpc error: code = Unimplemented desc = unknown service runtime.v1alpha2.RuntimeService" filter="&ContainerFilter{Id:,State:&ContainerStateValue{State:CONTAINER_RUNNING,},PodSandboxId:,LabelSelector:map[string]string{},}"
FATA[0000] listing containers: rpc error: code = Unimplemented desc = unknown service runtime.v1alpha2.RuntimeService
Looking at the plugins, there were some in an error state
kubeserver:~ # ctr plugins ls
TYPE                                  ID                       PLATFORMS      STATUS
io.containerd.content.v1              content                  -              ok
io.containerd.snapshotter.v1          aufs                     linux/amd64    skip
io.containerd.snapshotter.v1          btrfs                    linux/amd64    skip
io.containerd.snapshotter.v1          devmapper                linux/amd64    error
io.containerd.snapshotter.v1          native                   linux/amd64    ok
io.containerd.snapshotter.v1          overlayfs                linux/amd64    error
io.containerd.snapshotter.v1          zfs                      linux/amd64    skip
So … it seemed reasonable to look for errors in the messages log from containerd. And, yeah, we had all sorts of errors. Including a rather scary one about reformatting the file system!
Mar 23 13:24:51 kubeserver containerd: time="2023-03-23T13:24:51.726984260-05:00" level=warning msg="failed to load plugin io.containerd.snapshotter.v1.overlayfs" error="/var/lib/containerd/io.containerd.snapshotter.v1.overlayfs does not support d_type. If the backing filesystem is xfs, please reformat with ftype=1 to enable d_type support"
That would do it — we have a dedicated partition for the k8s stuff … and that volume is formatted the right way — xfs_info confirmed ftype=1
kubeserver:~ # xfs_info /kubernetes/
meta-data=/dev/mapper/kubernetes-kubernetes isize=512    agcount=4, agsize=131071744 blks
         =                       sectsz=512   attr=2, projid32bit=1
         =                       crc=1        finobt=0 spinodes=0
data     =                       bsize=4096   blocks=524286976, imaxpct=5
         =                       sunit=0      swidth=0 blks
naming   =version 2              bsize=4096   ascii-ci=0 ftype=1
log      =internal               bsize=4096   blocks=255999, version=2
         =                       sectsz=512   sunit=0 blks, lazy-count=1
realtime =none                   extsz=4096   blocks=0, rtextents=0
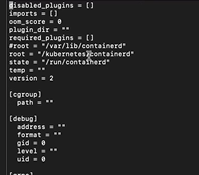
However containerd doesn’t really know anything about this volume, does it? The default location that containerd wants to use isn’t set up to support d_type. Editing /etc/containerd/config.toml, root now tells containerd to use our special partition for ‘stuff’ …
And we were able to run kubeadm init without error. Everything came up as it should have, and our k8s server was upgraded!