Sept 5, 2022 – May 13, 2026
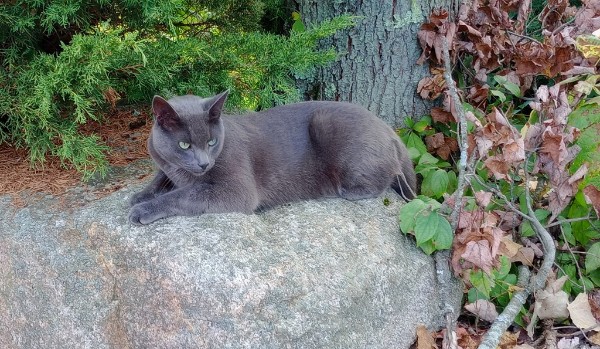
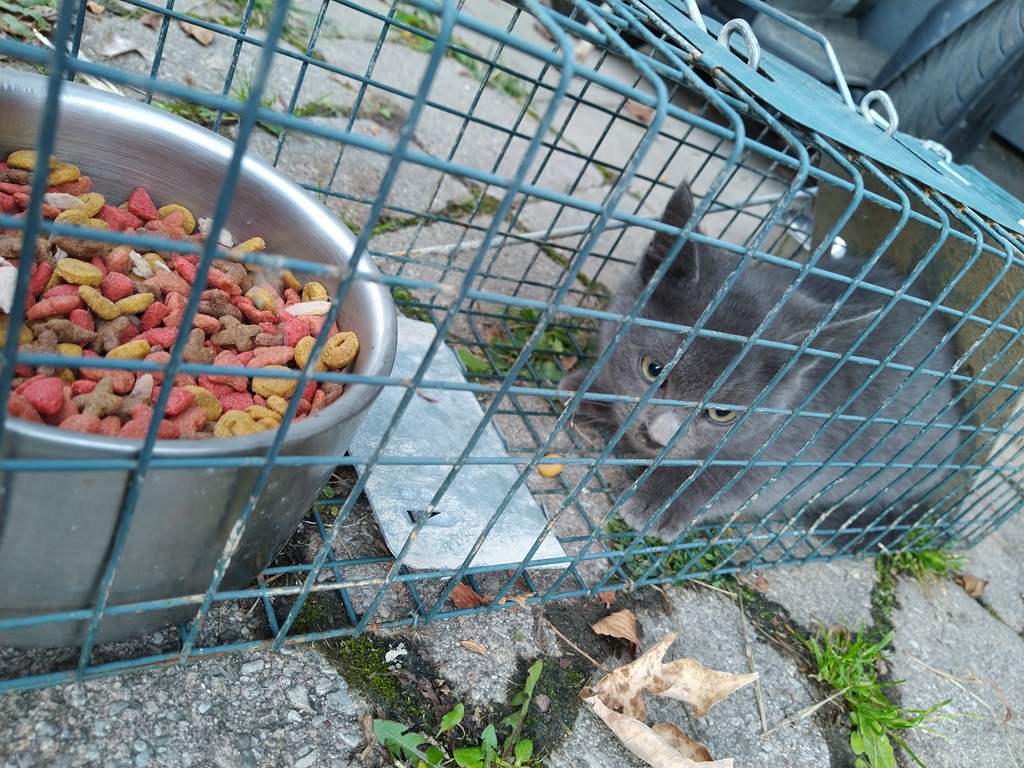
When Patches and the four kittens would come to eat and play on our back patio, we noticed that they never really meowed. And then, on October 28, 2022 — we heard a little kitten meow. The little gray kitten had been left behind – the cat Scott had decided was the coolest one. We got a little trap and baited it with cat food and tuna bits. And caught our little Ash.
We petted him and fed him, and he would curl up on one of us to be extra warm to take a nap. He had the loudest purr I’ve ever heard. You could hear from across the room whenever he was happy. And he was so happy. He loved to be scratched at – ruffling up his fur, then smoothing it back down so he was a sleek, tiny panther again.
He was a spooky cat, very skittish until he got to know and love you. I’d hang out with Anya in her room and play with her while Ash was in her room. One day, we were laying on the bed and he climbed up on my leg. Froze when I looked at him, so I looked away. He walked up my leg and onto my back. Then there was a little kitten head poking over my shoulder. He learned to trust me. Inside! I could pick him up, pet him, and play with him. It took a while before he would come up to me outside. I was cleaning a spot to plant some comfrey and asparagus over by the orchard. Crawling around on the ground, picking out all the weeds. He slowly made his way over to me, creeping closer and closer, and eventually wanted to be petted. I took a long break to talk to him, pet him, and snuggle him. Since then, when I’d go outside, he would usually stop whatever he was doing to run over and greet me.
He had a great smile and always looked thrilled when one of his “people” came outside to hang out. He’d run up with a happy murr-ur. Follow me and ‘help’. He’d even brave the giant growly lawnmower monster to follow me around the yard when I’d use the push-mower. We’d walk over to the chicken coop to let the chickens and turkeys out, he’d come back to the house with me, and then he’d go do cat things for the day. In the winter, he’d carefully follow behind me in the trail I broke through the snow, while his brother would bound across the foot-deep snow into the woods. He’d come with Anya and I as we gathered maple syrup – going from the back woods to the farm, and back to the house. He ducked into the covered cub cadet with us when it started raining, walked along the river as Anya looked for rocks, and was always on the look for chipmunks to pounce on. He’d follow me a lot inside, too. Walking up to the laundry room to get more cat food, bring laundry from the drier into my bedroom and fold it, then back downstairs. Or back and forth into the pantry while I gathered ingredients for dinner.
He was the snuggliest cat I’ve ever met. He would weave between my legs while I was walking outside; I frequently picked him up, held him, and petted him as I walked somewhere. He’d nuzzle his forehead under my chin or scan the yard for prey. If he saw a bird, he’d leap from my arms to try and get it. He loved getting his belly petted. His belly had the softest, silkiest fur. And he was growing two white patches – one on his chest and one farther down on his abdomen. They were getting bigger as he got older, and I thought he might turn into Ash the White like Gandolf.
He was such a smart cat. He learned how to open the garage door to follow me inside when I needed to grab some tools. As I was going through the drawers, trying to find something, I heard a creaky noise behind me. Turning around, the garage door was open and he came trotting over purring and asking to be petted. He would open the laundry room door, so we had to lock it at bedtime.
We used to have trouble rounding the cats up at night, but I got canned cat food. We started bringing them inside at night and giving them canned food for “dinner”. He loved kitten dinner time. Rarely had trouble getting Ash to come in at night. He’d come with us to round up the birds and happily run into the house for dinner.
He loved butchering day – the best farm cat day of the year. He would get excited if I picked up the big, white cutting boards and carry them toward the family room door. It’s hard to walk when you’ve got two 18×30 pieces of plastic in your hands and a big, strong cat weaving between your legs and purring at you. The first butchering day, Ash and Dumplin were so hyper after eating the trim meat I’d throw for them. Zooming around the yard and running up trees. Ash climbed so high on one of the big trees that Anya was worried he wouldn’t get down safely.
He’d climb the ornamental pine at the corner of the garage and hop onto the roof. Looking from the driveway, there’d be a cat walking around on the roof.
As he got a little older, he liked to come into the family room for a nap during the day. He’d sleep on the sofa, either in Anya’s spot while she was at school or snuggled up next to me. When the weather was nice, he would have cat adventures then come back to nap on one of the benches on the back patio or some giant slice of a tree. If he wanted to come inside and no one noticed him, he’d crawl up the screen door (which irritated Scott endlessly) – was very noticeable!
He started having seizures three weeks ago. Trips to the emergency vet, medicine and more medicine. I thought the medicine was working since he had three seizure free days. He was snoozy from the drugs, and spent a lot of time being held while he slept. Petted, brushed, and loved. Comforted after each seizure. He knew how much we loved him, and he was with his people until the end.
May Starclan light your path. May you find swift running, good hunting, and shelter where you sleep.