We had an issue where an IOT device was not able to establish the connection it wanted — it would report it couldn’t connect to the Internet. I knew it could connect to the Internet in general; but, without knowing what tiny part of the Internet it used to determine ‘connected’ or ‘not connected’, we were stuck. Except! We recently upgraded the switch in our house to a Cisco Catalyst 2960S — which allows me to do one of the cool things I’d seen the network guys at work do but had never been able to reproduce at home: using SPAN (Switched Port ANalyzer). When we’d encounter strange behavior with a network device where we couldn’t just install Wireshark and get a network capture, the network group would basically clone all of the traffic sent to the device’s port to another switch port where we could capture traffic. They would send me a capture file, and it was just like having a Wireshark capture.
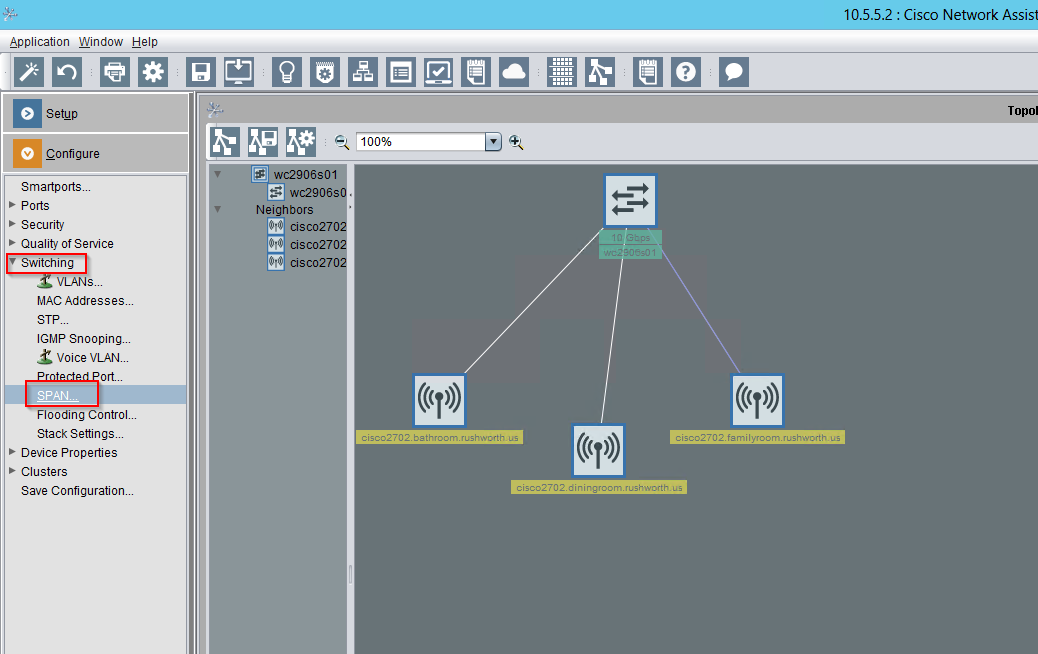
You can set up SPAN from the command line configuration, but I don’t have a username/password pair to log into SSH (and can only establish this from the command line configuration). Before breaking out the Cisco console cable, I tried running Cisco Network Assistant (unfortunately, a discontinued product line). One of the options under “Configure” => “Switching” is SPAN:
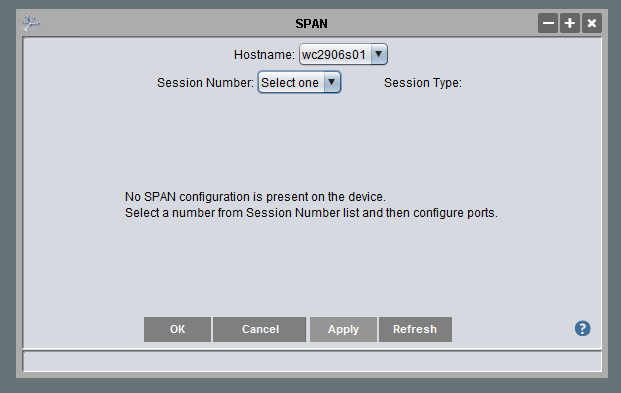
Since there was no existing SPAN session, I had to select a session number.
Then find the two ports — in the Ingress/Egress/Destination column, the port that is getting the traffic you want needs to either have Ingress (only incoming traffic), Egress (only outgoing traffic), or Both (all traffic). The port to which you want to clone the traffic is set to Destination. And the destination encapsulation is Replicate. Click apply.
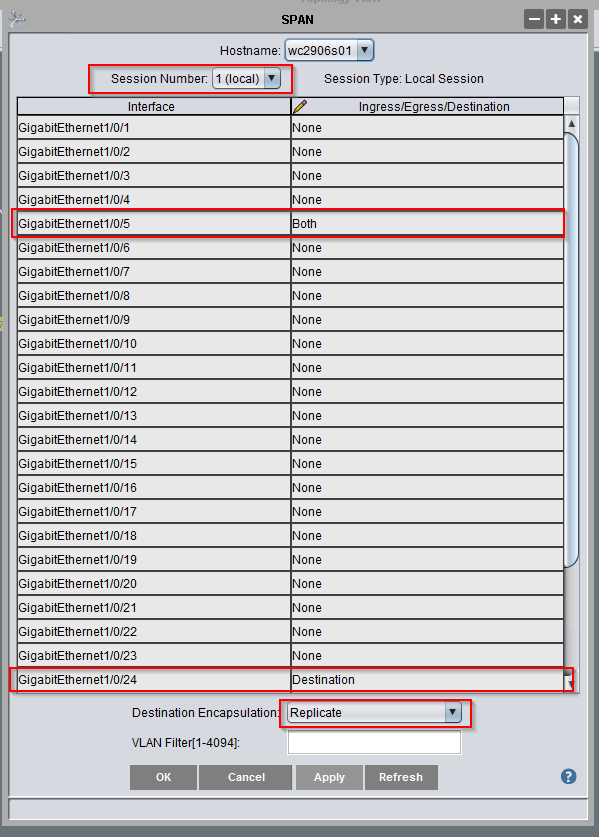
In the example above, the laptop plugged in to GE1/0/24 gets all of the traffic traversing GE1/0/5 — running tshark -w /tmp/TheProblem.cap writes the packet capture to a file for later analysis. Caveat — the destination port is no longer “online” — it receives traffic but isn’t sending or receiving its own traffic … so make sure you aren’t using remote access to control the device!
To remove the SPAN, change the Ingress/Egress/Destination values back to “none”, change the destination encapsulation back to select one, and apply.
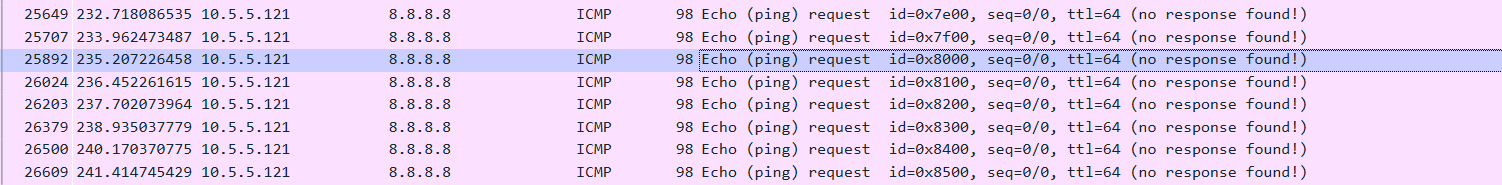
Since the source port is connected to one of our wireless access points, the network capture encompasses all wireless traffic through that access point.
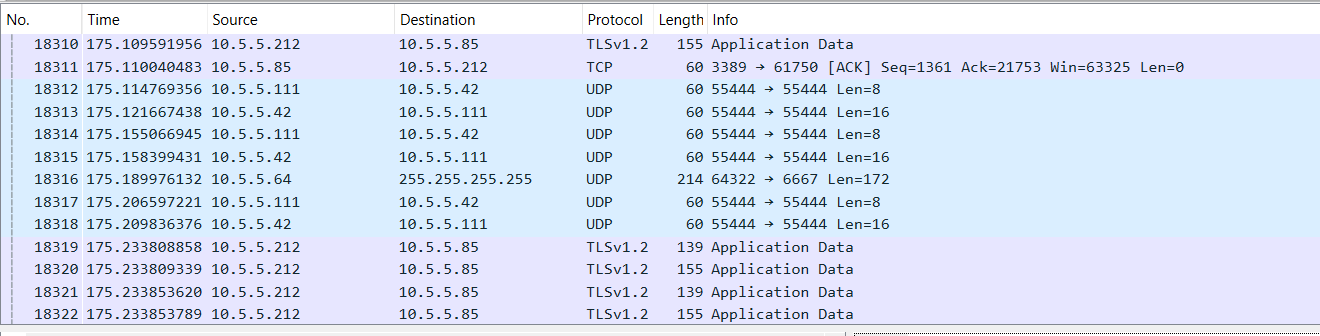
And we were easily able to identify that this particular device uses the rule “I can ping 8.8.8.8” to determine if it is connected to the Internet. We were able to identify a firewall rule that prevented ICMP replies; allowing this traffic immediately allowed the devices to connect as expected.