Tag: troubleshooting

Teams Debugging

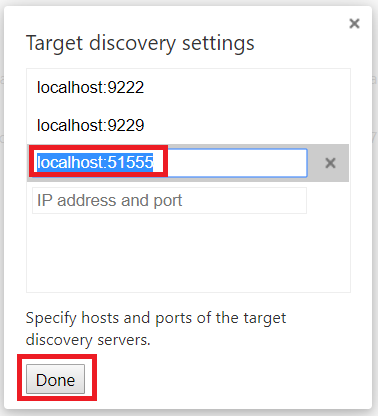
The Teams desktop client is an Electron application – which means you can debug the Teams client just like any other Electron application. To set up debugging through Chrome, open Chrome to chrome://inspect Configure network targets. Click “Configure”

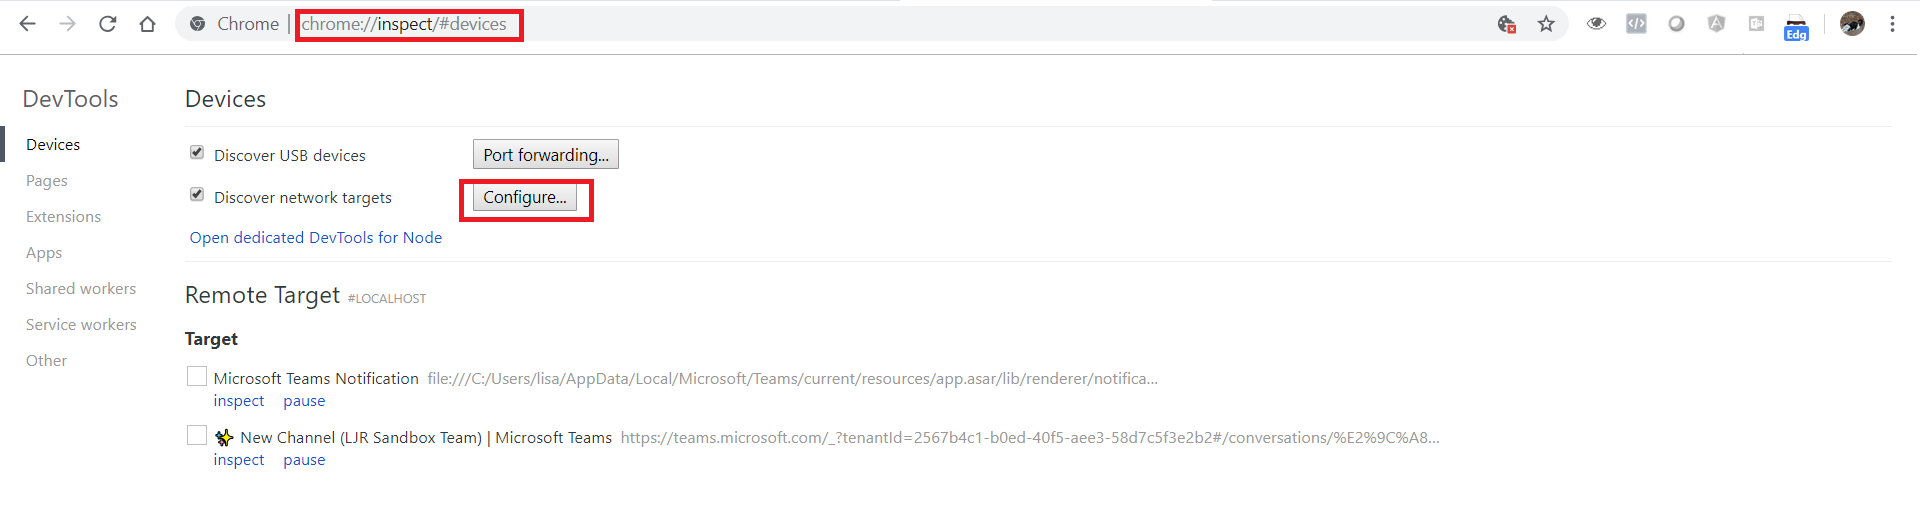
Add an unused port to be used for Teams debugging.

Run Teams with the remote debugging flag port set to the same port you added above. E.g.

%userprofile%\AppData\Local\Microsoft\Teams\current\Teams.exe –remote-debugging-port=51555

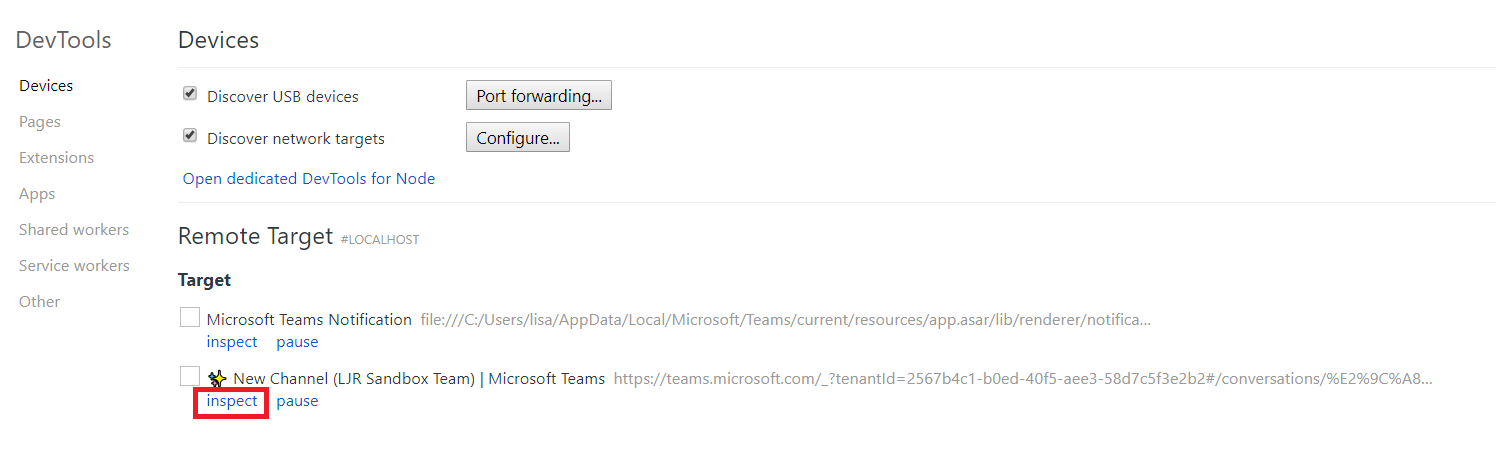
Now you’ve got access to the Electron app in Chrome. Click on “Inspect” for the thread you want to watch

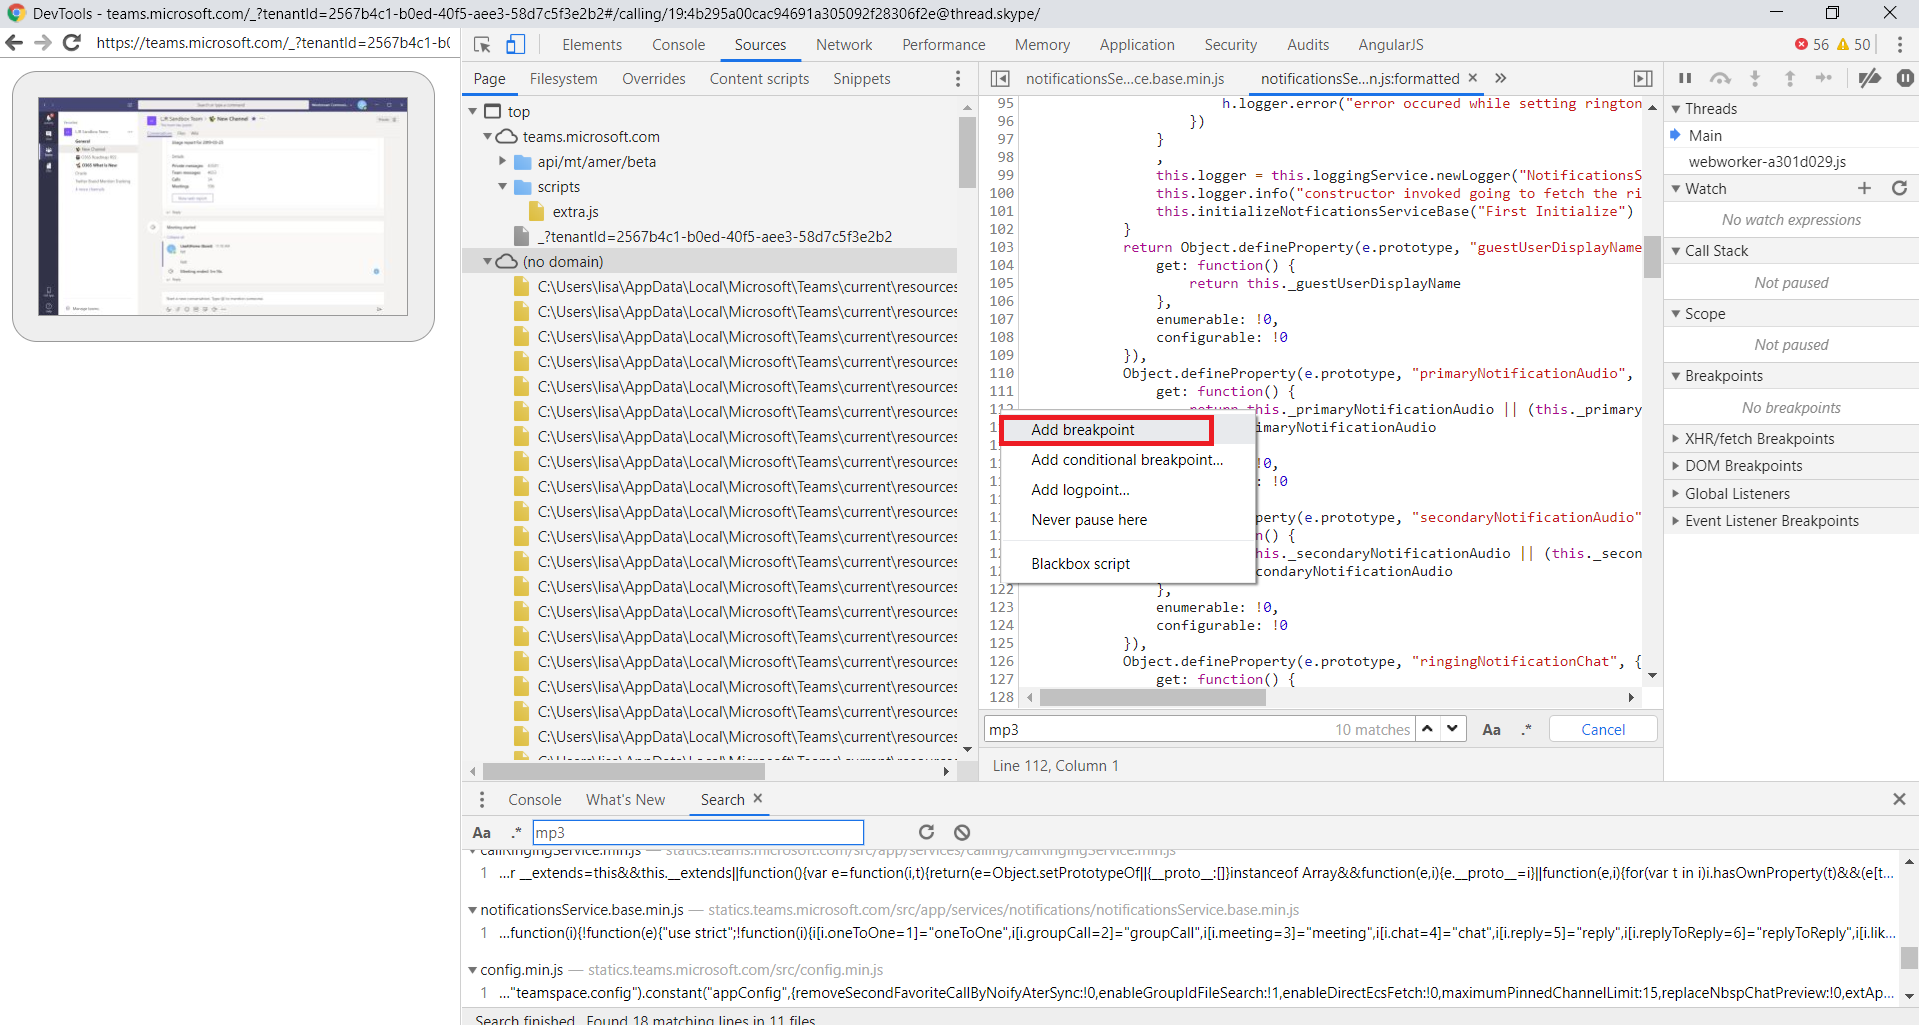
You can add break-points in the code to pause program execution.

You’ll see a “Paused in debugger” indicator when a breakpoint is reached. You can resume or step over using this indicator, or you can use the DevTools debugger – the DevTools debugger also allows you to proceed one step at a time through program execution (F9).

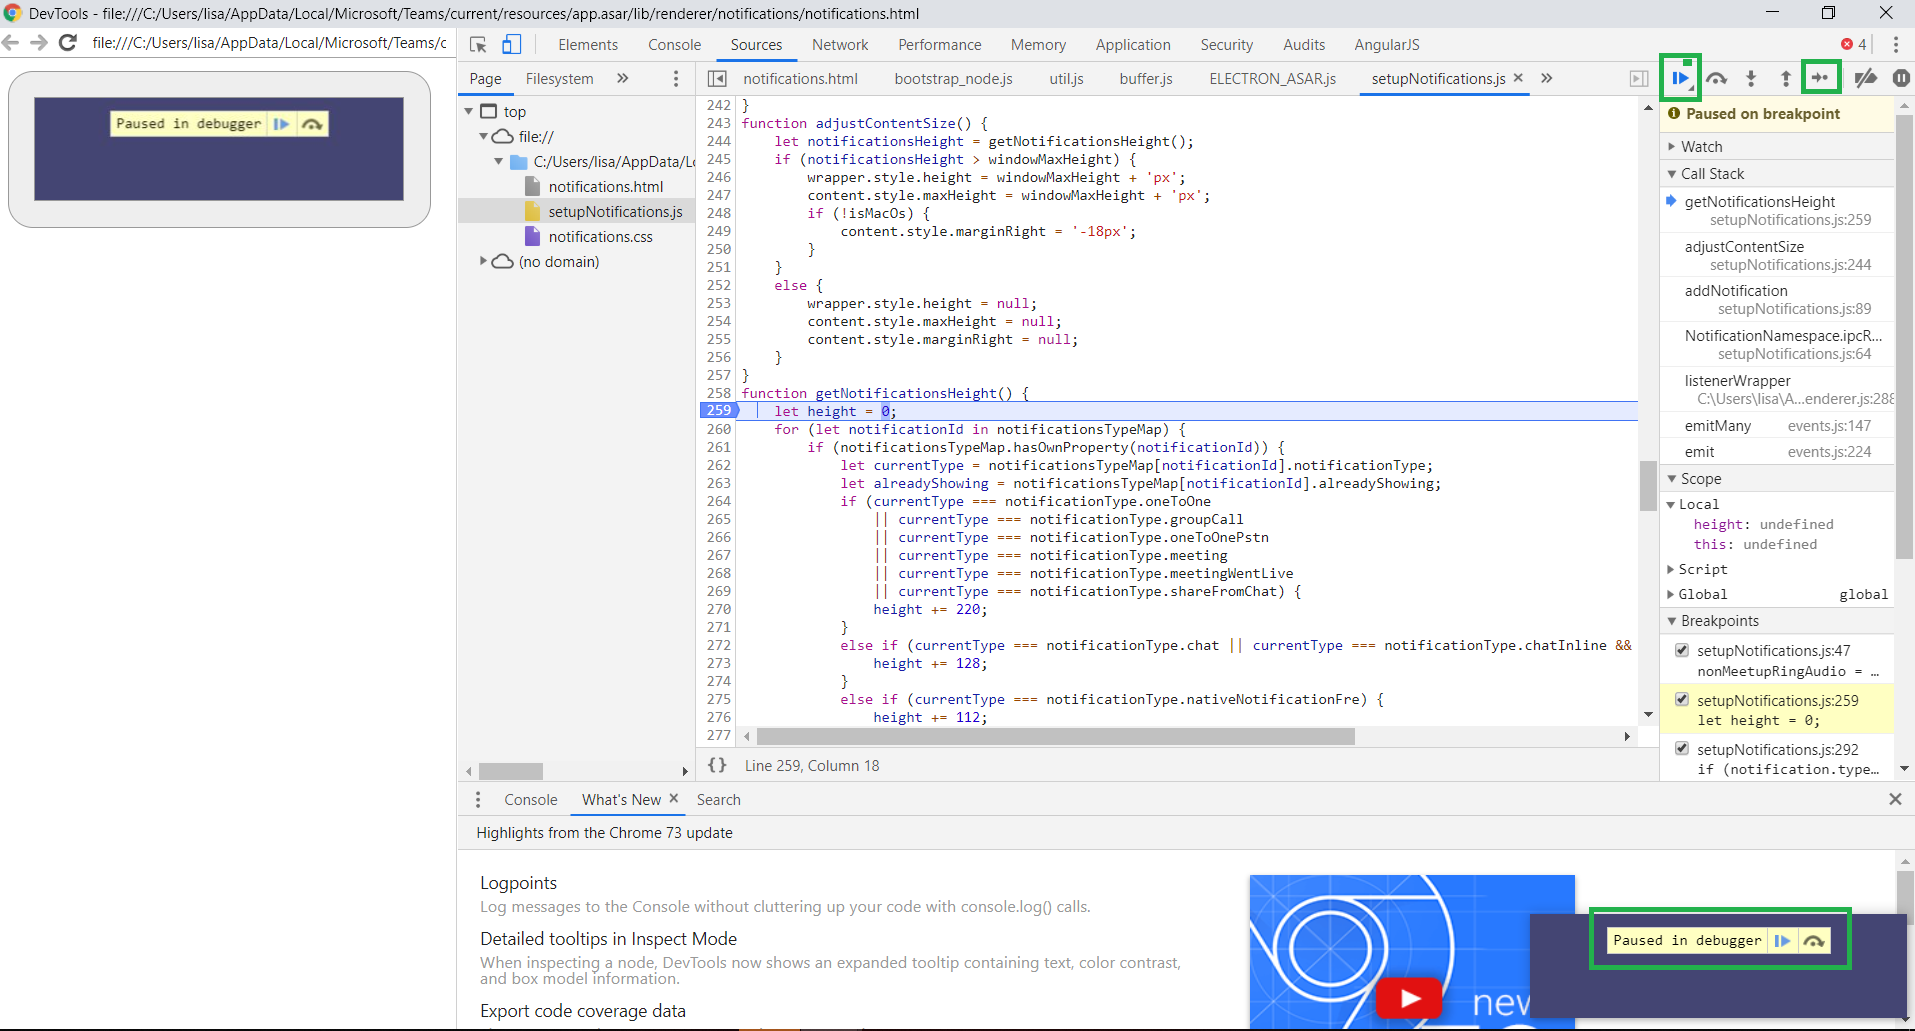
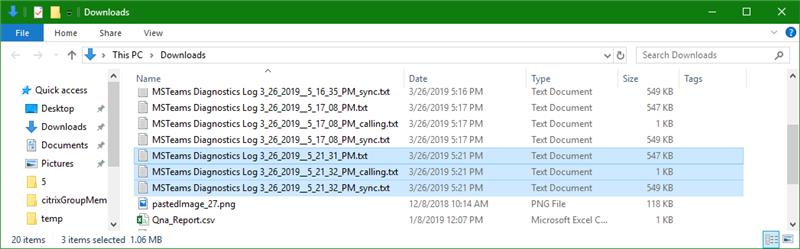
Through the debugger, I was able to identify the source of the weak little notification ding

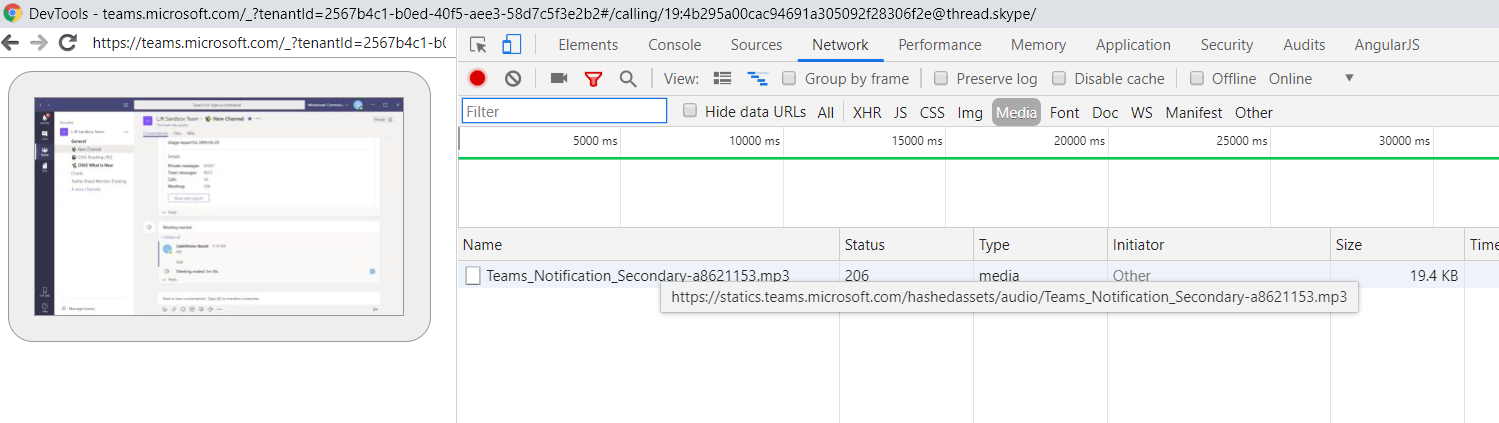
https://statics.teams.microsoft.com/hashedassets/audio/Teams_Notification_Secondary-a8621153.mp3

Which means I can redirect this URL … really anything that matches the URL up through Teams_Notification because I expect the alpha-numeric at the end to change and I’m sure there’s a primary notification 😊 … and make the notification noticeable.

Looking through the package, I see eighteen different ‘ringtone’ type MP3 files, and only three lines of code that use them. Hopefully this is an indicator that MS has begun development of some user-selectable notification sounds in the desktop client.

nonMeetupRingAudio = new Audio(data.assetsPath + ‘audio/ring.mp3’);

meetupRingAudio = new Audio(data.assetsPath + ‘audio/meetup_ring.mp3’);

screenshareRingAudio = new Audio(data.assetsPath + ‘audio/screenshare_ring.mp3’);


Accessing MS Teams Log Files

There are two sets of log files that we can use to troubleshoot Microsoft Teams issues.

Debug Logs On Windows, these are accessed by holding CTRL + ALT + SHIFT + 1 … on OSX holding Option + Command + Shift + 1 — both the desktop and web client will download three files. In the web client, you’ve got to tell it to save each file individually. The desktop client automatically stashes the files in your downloads folder (sorry, OSX folks, not a clue where your files are!).

Bootstrap log: Teams desktop also has bootstrap logs at %appdata%\Microsoft\Teams\logs.txt This file is generally useful for launch failures, authentication failures, and issues where the app is restarting. Once Teams is started, only background authentication ‘stuff’ is logged here.

If you’re inclined to read them, the debug client log is JSON formatted text followed by lines with timestamp, message level, and the message. War (Warning), Err (Error), Inf (Informational) messages appear in the log. When my Internet connection goes flaky, I get “War” messages with timeouts. But I’ve also seen really strange errors about the back-end Skype call not being found (AFAIK, Skype and Teams share a back-end calling infrastructure. The Skype back-end was upgraded for the Teams launch, but it’s a shared resource).

I pull the log file into Excel and split it into columns with the timestamp, severity, and log data. You can use

=DATEVALUE(MID(A1,1,10))+TIMEVALUE(MID(A1,12,8))

to convert an ISO8601 timestamp into a value on which Excel can perform calculations. You can also just reformat it by replacing ‘T’ with a space and removing the ‘Z’ https://assets2.jiveon.com/core/2016.3.10.4.179277c/images/emoticons/happy.png

For some activities, you can isolate the end-to-end transaction. This means you can also calculate how long the transaction took. At-mentions are great because they’ve got an obvious start (search text entered … length 0 means just the @ symbol was used. You’ll see different lengths depending on what the user actually types) and an obvious end (dropdown is shown for X search results). There’s also a single remote call (calling atMentionsService.SearchForUserPrifileInChannel) and response (scope.processSearchResults) where you can determine delay introduced outside the local computer.

When performing calculations in Excel with DateTime objects, the result is in unit days. To display the results in seconds, multiply this by 86400 (number of seconds in a day, which anyone who ever administered Bind zone files will be able to tell you off the top of their head … otherwise 24 * 60 * 60)

In the at-mention above, it took a little over half a second to complete and all of that time was the network call.