Tag: ELK

Python Logging to Logstash Server

Since we are having a problem with some of our filebeat servers actually delivering data over to logstash, I put together a really quick python script that connects to the logstash server and sends a log record. I can then run tcpdump on the logstash server and hopefully see what is going wrong.

import logging
import logstash
import sys

strHost = 'logstash.example.com'
iPort = 5048

test_logger = logging.getLogger('python-logstash-logger')
test_logger.setLevel(logging.INFO)
test_logger.addHandler(logstash.TCPLogstashHandler(host=strHost,port=iPort))

test_logger.info('May 22 23:34:13 ABCDOHEFG66SC03 sipd[3863cc60] CRITICAL One or more Dns Servers are currently unreachable!')
test_logger.warning('May 22 23:34:13 ABCDOHEFG66SC03 sipd[3863cc60] CRITICAL One or more Dns Servers are currently unreachable!')
test_logger.error('May 22 23:34:13 ABCDOHEFG66SC03 sipd[3863cc60] CRITICAL One or more Dns Servers are currently unreachable!')

ElasticSearch Analyzer

Analyzer Components

Character filters are the first component of an analyzer. They can remove unwanted characters – this could be html tags (“char_filter”: [“html_strip”]) or some custom replacement – or change character(s) into other character(s). Output from the character filter is passed to the tokenizer.

The tokenizer breaks the string out into individual components (tokens). A commonly used tokenizer is the whitespace tokenizer which uses whitespace characters as the token delimiter. For CSV data, you could build a custom pattern tokenizer with “,” as the delimiter.

Then token filters removes anything deemed unnecessary. The standard token filter applies a lower-case function too – so NOW, Now, and now all produce the same token.

Testing an analyzer

You can one-off analyze a string using any of the

curl -u “admin:admin” -k -X GET https://localhost:9200/_analyze –header ‘Content-Type: application/json’ –data ‘

“analyzer”:”standard”,

“text”: “THE QUICK BROWN FOX JUMPED OVER THE LAZY DOG’\”S BACK 1234567890″

}’

Specifying different analyzers produces different tokens

It’s even possible to define a custom analyzer in an index – you’ll see this in the index configuration. Adding character mappings to a custom filter – the example used in Elastic’s documentation maps Arabic numbers to their European counterparts – might be a useful tool in our implementation. One of the examples is turning ASCII emoticons into emotional descriptors (_happy_, _sad_, _crying_, _raspberry_, etc) that would be useful in analyzing customer communications. In log processing, we might want to map phrases into commonly used abbreviations (not a real-world example, but if programmatic input spelled out “self-contained breathing apparatus”, I expect most people would still search for SCBA if they wanted to see how frequently SCBA tanks were used for call-outs). It will be interesting to see how frequently programmatic input doesn’t line up with user expectations to see if character mappings will be beneficial.

In addition to testing individual analyzers, you can test the analyzer associated to an index – instead of using the /_analyze endpoint, use the /indexname/_analyze endpoint.


Resetting Lost/Forgotten ElasticSearch Admin Passwords

There are a few ways to reset the password on an individual account … but they require you to have a known password. But what about when you don’t have any good passwords? (You might be able to read your kibana.yml and get a known good password, so that would be a good place to check). Provided you have OS access, just create another superuser account using the elasticsearch-users binary:

/usr/share/elasticsearch/bin/elasticsearch-users useradd ljradmin -p S0m3pA5sw0Rd -r superuser

You can then use curl to the ElasticSearch API to reset the elastic account password

curl -s --user ljradmin:S0m3pA5sw0Rd -XPUT "http://127.0.0.1:9200/_xpack/security/user/elastic/_password" -H 'Content-Type: application/json' -d'
{
"password" : "N3wPa5sw0Rd4ElasticU53r"
}
'


ElasticSearch ILM – Data Lifecycle

The following defines a simple data lifecycle policy we use for event log data.

Immediately, the data is in the “hot” phase.

After one day, it is moved to the “warm” phase where the number of segments is compressed to 1 (lots-o-segments are good for writing, but since we’re dealing with timescale stats & log data [i.e. something that’s not being written to the next day], there is no need to optimize write performance. The index will be read only, thus can be optimized for read performance). After seven days, the index is frozen (mostly moved out of memory) as in this use case, data generally isn’t used after a week. Thus, there is no need to fill up the server’s memory to speed up access to unused data elements. Since freeze is deprecated in a future version (due to improvements in memory utilization that should obsolete freezing indices), we’ll need to watch our memory usage after upgrading to ES8.

Finally, after fourteen days, the data is deleted.

To use the policy, set it as the template on an index:

Upon creating a new index (ljrlogs-5), the ILM policy has been applied:

Kibana – Defining Index Patterns

This isn’t something I will notice again now that I’ve got my heap space sorted … but when you are using Kibana to add index patterns, there’s nothing that waits until you’ve stopped typing for x seconds or implements a minimum characters before searching. So, after each character you type into the dialog, a search is performed against the ES server — here I wanted to create a pattern for logstash-* — which sent nine different search requests to my ES. And, if the server is operating reasonably, all of these searches would deliver a result set that Kibana essentially ignores as I’m tying more characters. But, in my case, the ES server fell over before I could even type logstash!

ElasticSearch Java Heap Size — Order of Precedence

I was asked to look at a malfunctioning ElasticSearch server this week. It’s a lab sandbox, so not a huge deal … but still something they wanted online and functioning for some proof-of-concept testing. And, as a bonus, they’re willing to let us use their lab servers for our own sandboxing (IPv6 implementation, ELK upgrades). There were a handful of problems (it looks like the whole thing used to be a multi-node cluster but the second cluster node has vanished without any trace, the entire platform was re-IP’d, vm.max_map_count wasn’t set on the Docker server, and the logstash folder had a backup of a pipeline config in /path/to/logstash/pipeline/ … which still loads, so causes a continual stream of port-in-use exceptions). But the biggest problem was that any attempt at actually using the ElasticSearch server resulted in it falling over. Java crashed with an out of memory error because the heap space was exhausted. Now I’ve had really small sandboxes before — my first ES sandbox only had a gig of memory and was quite prone to this crash. But the lab server they’ve set up has 64GB of memory. So allocating a few gigs seemed like a quick solution.

The jvm.options file and jvm.options.d folder weren’t mounted into the container — they were the default files held within the container. Which seemed odd, and I made a mental note that it was something we’d need to either mount in or update again when the container gets updated. But no matter how much heap space I allocated, ES crashed.

I discovered that the Docker deployment set an ENV variable for ES_JAVA_OPTS — something which, per the ElasticSearch documentation, overrides all other JVM options. So no matter what I was putting into the jvm options file, the 256 meg set in the ENV was actually being used.

Luckily it’s not terribly difficult to modify the ENV’s within an existing container. You could, of course, redeploy the container with the new settings (and I’ll do that next time, since I’ve also got to get IPv6 enabled). But I wasn’t planning on making any other changes.

ElasticSearch – Useful API Commands

In all of these examples, the copy/paste text uses localhost and port 9200. Since some of my sandboxes don’t use the default port, some of the example outputs will use a different port. Obviously, use your hostname and port. And, if your ES instance requires authentication, add the “-u” option with the user (or user:password … but that’s not a good idea outside of sandboxes as the password is then stored to the shell history). If you are using https for the API endpoint, you may also need to add the “-k” option to establish an untrusted SSL connection (e.g. the CA isn’t trusted by your OS).

curl -k -u elastic https://localhost...

Listing All Indices

Use the following command to list all of the indices in the ES system:

curl http://localhost:9200/_cat/indices?v

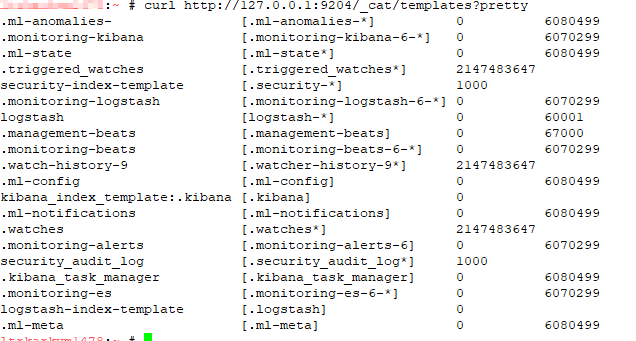
Listing All Templates

Use the following command to list all of the templates:
curl http://localhost:9200/_cat/templates?pretty

Explain Shard Allocation

I was asked to help get a ELK installation back into working order — one of the things I noticed is that all of the indices were yellow. The log file showed allocation errors. This command reported on the allocation decision that was being made. In the case I was looking at, the problem became immediately obvious — it was a single node system and 1 replica was defined. The explanation was that the shard could not be stored because it already existed in that place.

curl http://localhost:9200/_cluster/allocation/explain

If the maximum number of allocation retries has been exceeded, you can force ES to re-try allocation (as an example, a disk was full for an extended period of time but space has been cleared and everything should work now)

curl http://localhost:9200/_cluster/reroute?retry_failed=true
Set the Number of Replicas for a Single Index

Once I identified that the single node ELK instance had indices configured

curl -X PUT \
http://127.0.0.1:9200/logstash-2021.05.08/_settings \
-H 'cache-control: no-cache' \
-H 'content-type: application/json' \
-d '{"index" : {"number_of_replicas" : 0}}
'

Add an Alias to an Index

To add an alias to an existing index, use PUT /<indexname>/_alias/<aliasname> — e.g.

PUT /ljr-2022.07.05/_alias/ljr