I noticed, today, that our Kafka Manager interface only shows details from one server — the one where we run Kafka Manager. We’ve done everything that we need to do in order to get this working — the port shows as open with nmap, the command to run Kafka includes all of the settings. I’ve even tried setting the JMX hostname, but still there is just one server reporting data
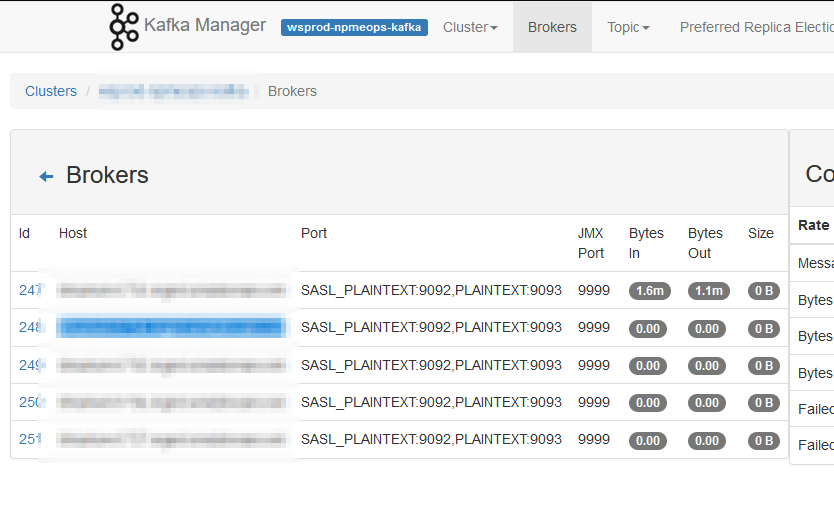
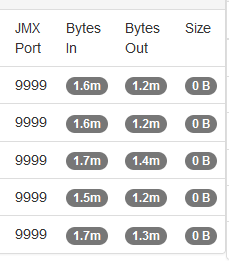
Then I happened across an article online that detailed how JMX actually uses three ports — the configured port 9999 and two other randomly selected and non-configurable ports. I used netstat to list all of the ports in use by the Java PID running my Kafka server and, voila, there were two odd-ball high ports (30000’s and 40000’s). I added those additional ports to the firewall rules and … I’ve got data for all of the Kafka servers!
This is obviously a short-term solution as the two randomly selected ports will be different when I restart the service next time. I’d prefer to leave the firewall in place (i.e. not just open all ports >1024 between the Kafka Manager host and all of the Kafka servers) so might put together a script to identify the “oddball” ports associated to the Java pid and add them to transient firewalld rules. But the last server restart was back in 2021 … so I might just manually add them after the upgrade next week and worry about something ‘better’ next year!