Schools in Ohio have been closed since 17 March (and a lot of districts stayed home on 16 March). Restaurants have been in delivery and carry-out mode for about the same length of time. We’ve been under a stay at home order since 24 March. And the important question is … is it helping? That’s a difficult question to answer because epidemiological predictions have very broad ranges because most of their inputs are so unknown … and the limited testing makes the data being compared wildly inaccurate. But we’ve only got the data we’ve got, so I thought I’d run some comparisons to see how Ohio is faring.
I selected the four states closest to Ohio in population — PA, IL, GA, and NC. Because these states all identified their first case well before Ohio, I added CT because the first case identified there was 08-Mar and Ohio’s first cases appear on 09-Mar.
| State | 1st Case | Population |
| PA | 6-Mar | 12,801,989 |
| IL | pre 4-Mar | 12,671,821 |
| OH | 9-Mar | 11,689,100 |
| GA | pre 4-Mar | 10,617,423 |
| NC | pre 4-Mar | 10,488,084 |
| CT | 8-Mar | 3,565,287 |
It looks like our curve is flattened — although North Carolina, where the first infection was identified earlier than Ohio and their their stay at home order was issued on on 27 March, has identified a thousand fewer cases as of yesterday.
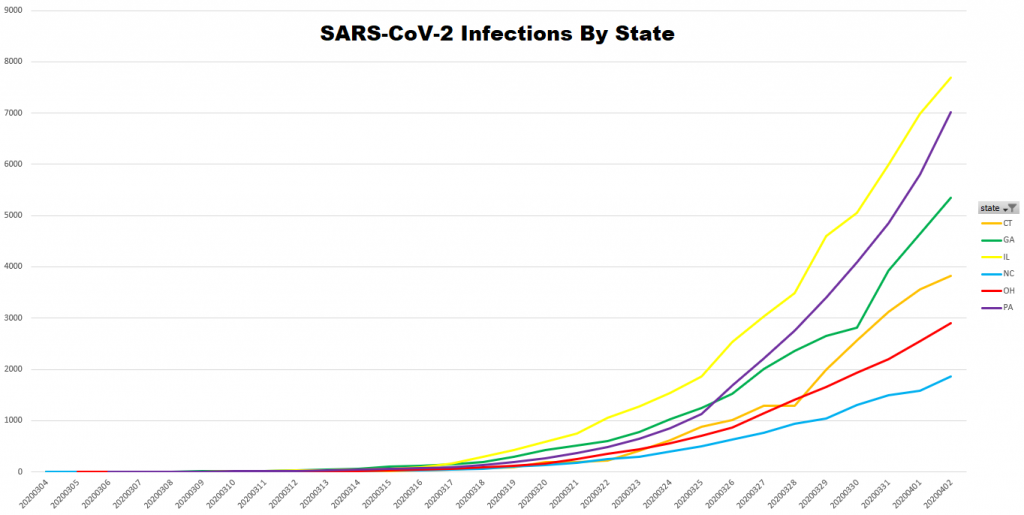
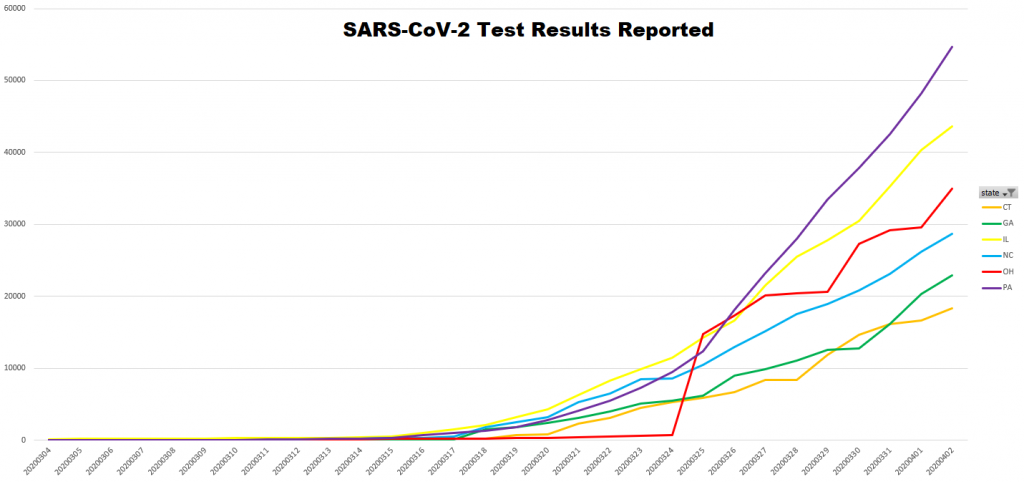
Is proximity to NYC a major factor? CT and PA (as well as NJ, which has a relatively high number of cases) are all right there. But Georgia and Illinois are farther away from NYC than Ohio. Is the number of tests a factor in these case numbers? I’d expected a higher correlation between the number of identified cases and the number of tests administered. GA and CT have fewer total test reports (positive + negative tests) and have more infected people. NC has more reported tests, but fewer cases than OH. PA and IL have more reported tests and more infected people.